Figure 2.
Download original image
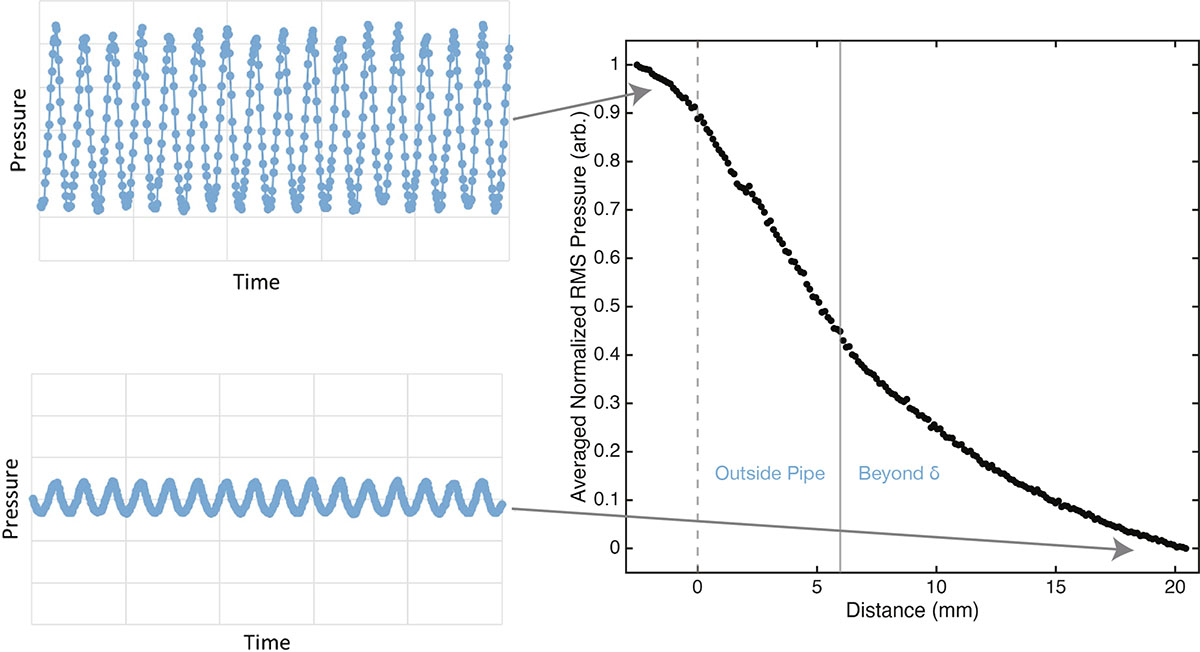
Raw data points recorded as pressure vs. time (blue scatter plots on left) represented as a point on the graph as a normalized RMS pressure from a distance from the physical end of the pipe in mm. The dashed, gray line represents the physical end of the pipe at zero and the solid gray line represents the end correction (δ) calculated from the measured frequency and the radius of the pipe using equation (2). The data to the left of δ are fit to a sinusoidal function, consistent with end-correction theory, which assumes a standing wave in this region. Beyond δ, where the wave is propagating, the data are fit to a 1/r function.
Current usage metrics show cumulative count of Article Views (full-text article views including HTML views, PDF and ePub downloads, according to the available data) and Abstracts Views on Vision4Press platform.
Data correspond to usage on the plateform after 2015. The current usage metrics is available 48-96 hours after online publication and is updated daily on week days.
Initial download of the metrics may take a while.