Figure 4.
Download original image
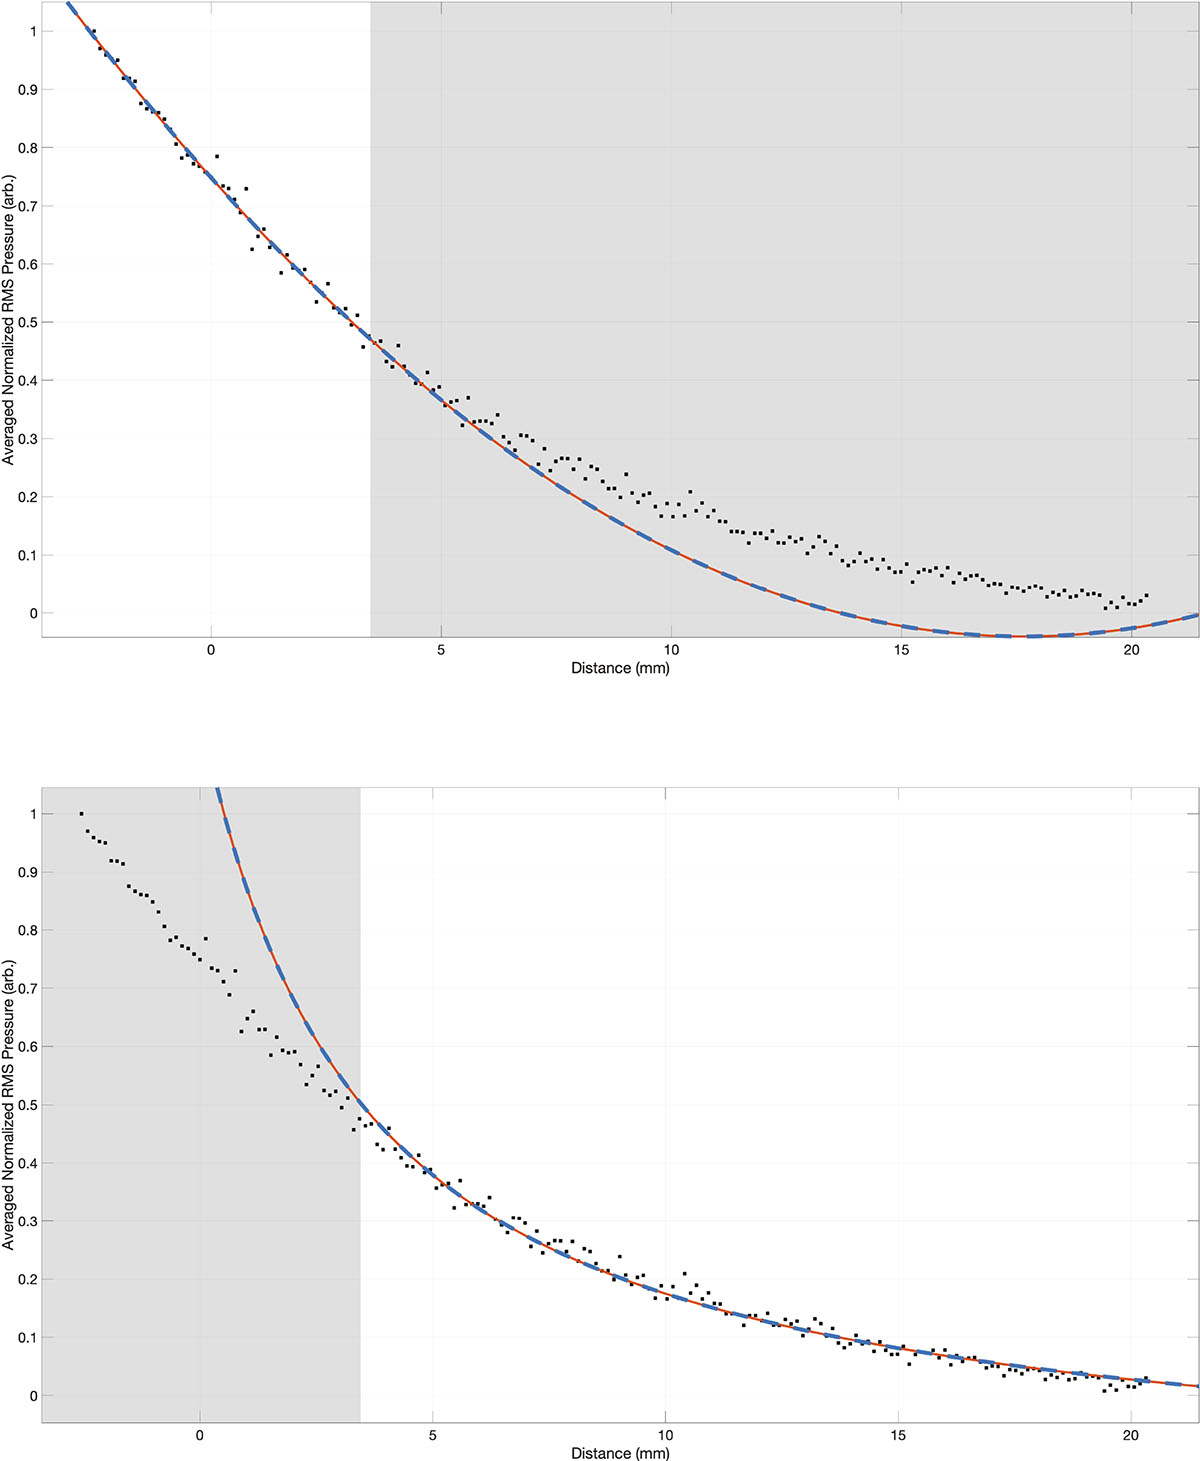
Normalized RMS pressure vs. position relative to the end of the pipe for a square pipe at 875 Hz. Top: standing-wave (inside) fit; bottom: radiating-wave (outside) fit. The gray shading indicates points excluded from the fit and was determined using equation (2). The LS fit (solid blue line) shows better phase alignment near δ inside compared to the empirical fit (dashed orange line), consistent with the lower SSE in Table 2; outside, the 1/(x + δ) decay is essentially identical for both models.
Current usage metrics show cumulative count of Article Views (full-text article views including HTML views, PDF and ePub downloads, according to the available data) and Abstracts Views on Vision4Press platform.
Data correspond to usage on the plateform after 2015. The current usage metrics is available 48-96 hours after online publication and is updated daily on week days.
Initial download of the metrics may take a while.