Figure 1.
Download original image
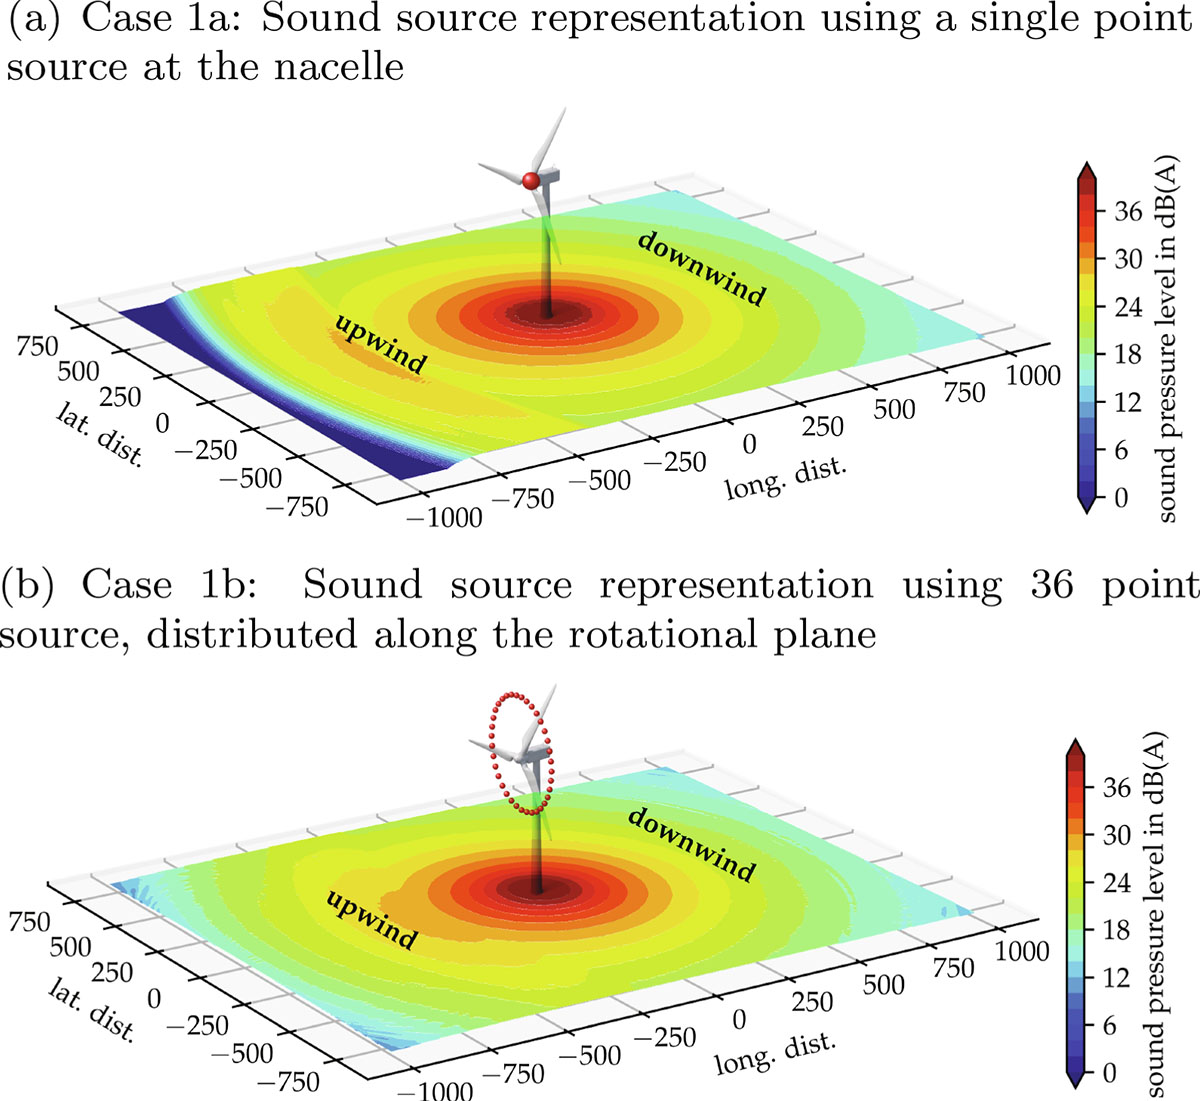
Simulated sound pressure level at ground level (4 m above ground) for test case 1. The increased sound levels in the upwind domain are clearly visible for both source setups, but more pronounced for the single point source setup (a). (a) Case 1a: Sound source representation using a single point source at the nacelle. (b) Case 1b: Sound source representation using 36 point sources, distributed along the rotational plane.
Current usage metrics show cumulative count of Article Views (full-text article views including HTML views, PDF and ePub downloads, according to the available data) and Abstracts Views on Vision4Press platform.
Data correspond to usage on the plateform after 2015. The current usage metrics is available 48-96 hours after online publication and is updated daily on week days.
Initial download of the metrics may take a while.