Open Access
Figure 2.
Download original image
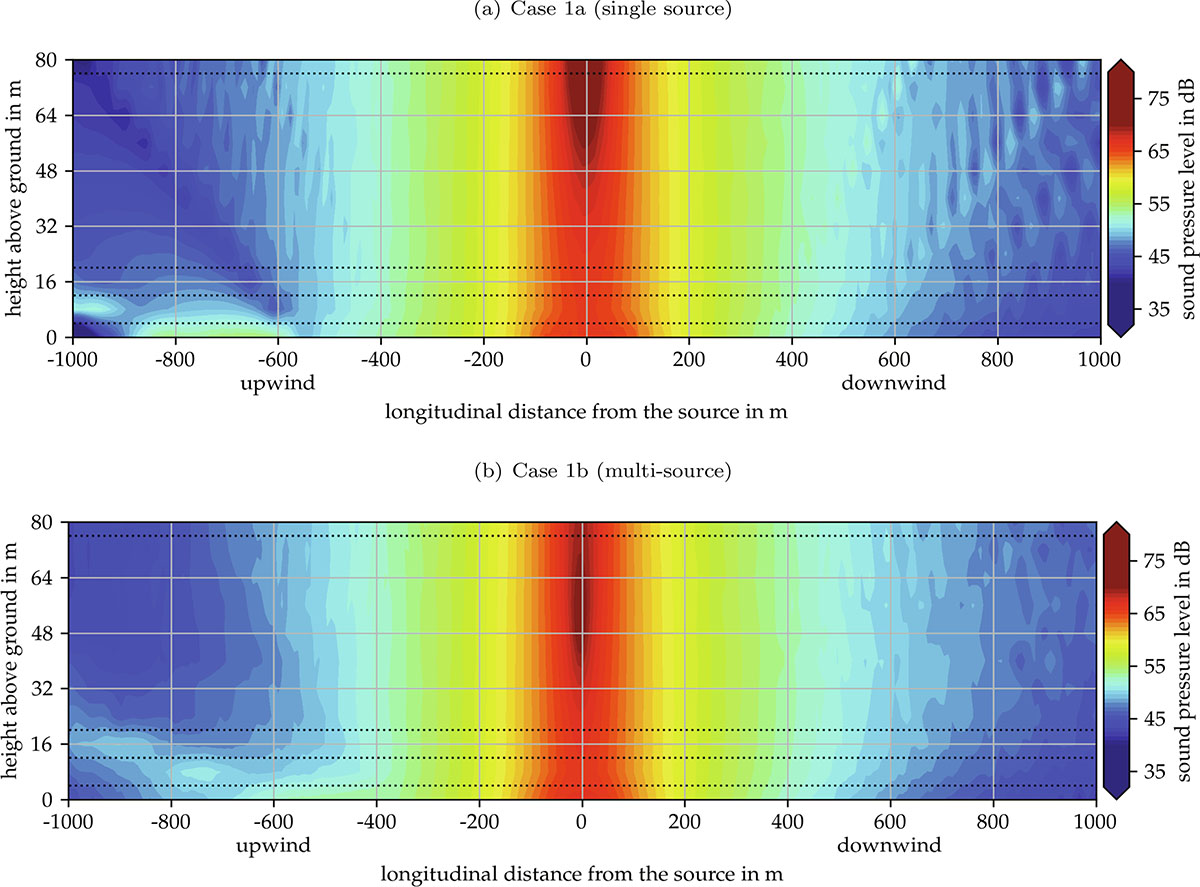
Vertical cross section of the sound pressure level field through the wind turbine (y = 0), shown for the lowest 80 m. The 4 black dashed lines indicate the mean heights of the sound pressure level curves shown in Figure 3. (a) Case 1a (single source). (b) Case 1b (multi-source).
Current usage metrics show cumulative count of Article Views (full-text article views including HTML views, PDF and ePub downloads, according to the available data) and Abstracts Views on Vision4Press platform.
Data correspond to usage on the plateform after 2015. The current usage metrics is available 48-96 hours after online publication and is updated daily on week days.
Initial download of the metrics may take a while.