Figure 7.
Download original image
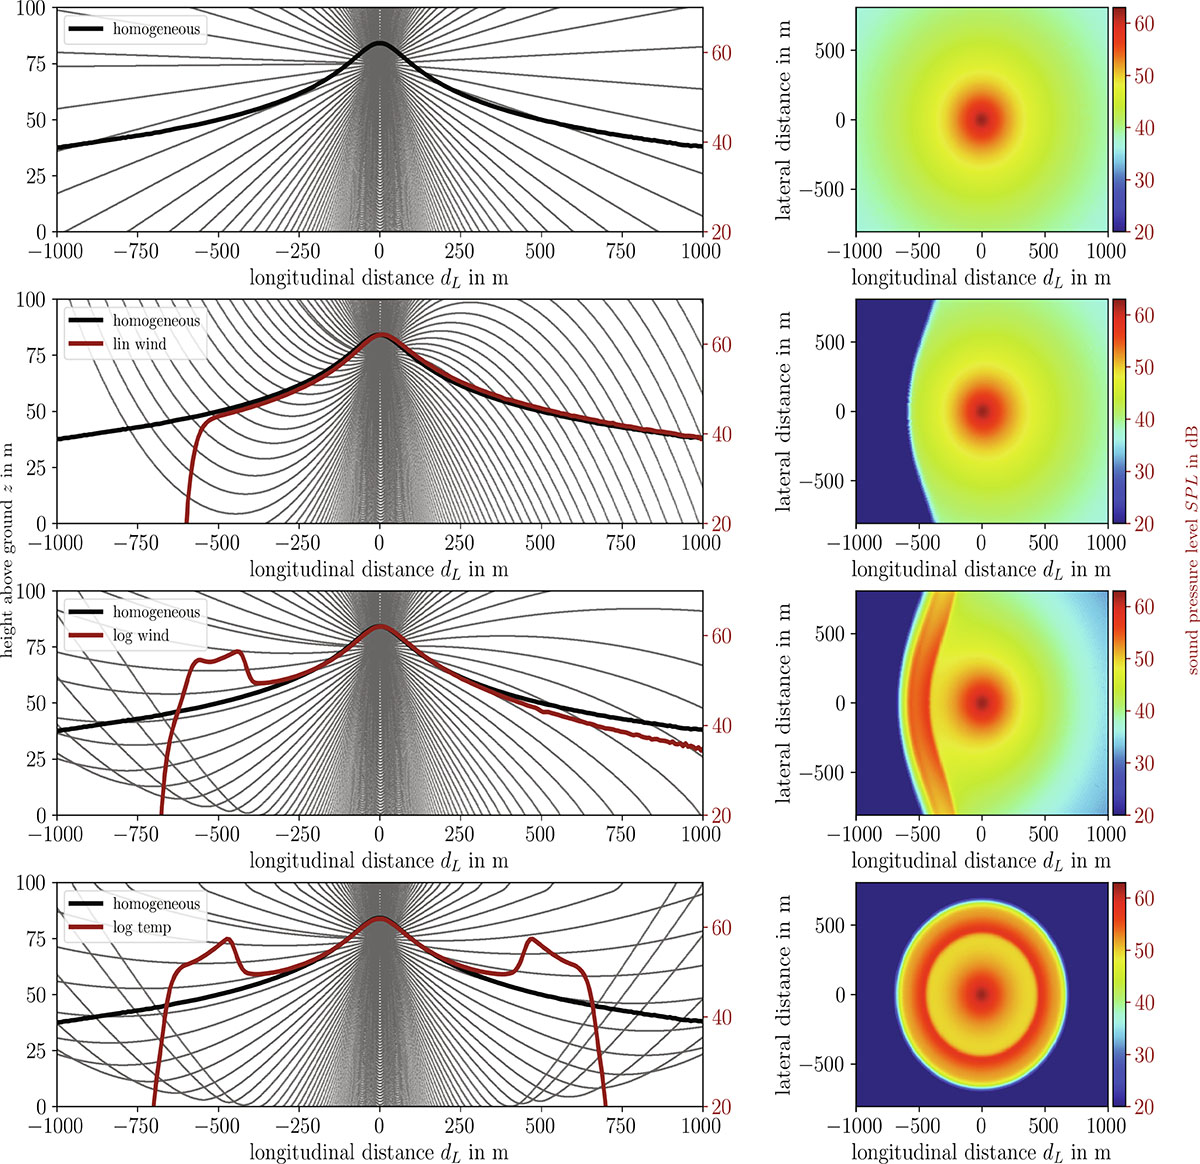
Results of Akumet (test cases 3a–3d, see Tabs. 4 and 5): Left side: vertical cross-sections through y = 0, indicating the sound rays resulting from the particle motion (grey, left axis). The sound pressure level through the source position is given in red (right axis). Right side: according sound pressure level fields at 4 m above ground are shown.
Current usage metrics show cumulative count of Article Views (full-text article views including HTML views, PDF and ePub downloads, according to the available data) and Abstracts Views on Vision4Press platform.
Data correspond to usage on the plateform after 2015. The current usage metrics is available 48-96 hours after online publication and is updated daily on week days.
Initial download of the metrics may take a while.