


Figure 1.
Download original image
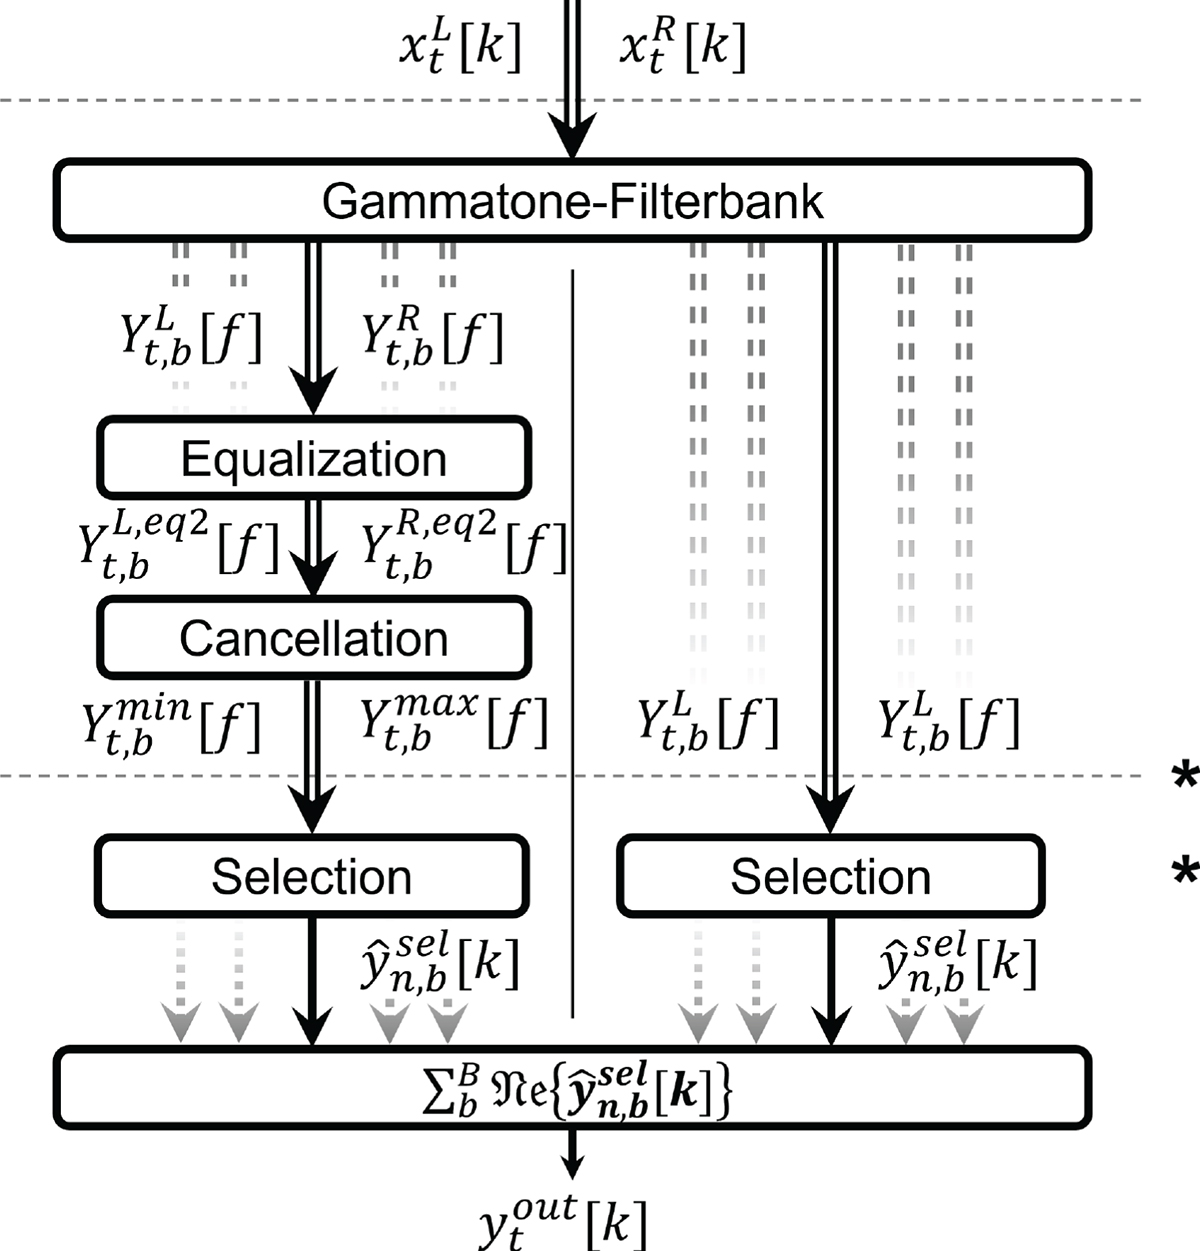
Overview of the front-end model. Horizontal dashed lines indicate a switch between time and spectral domain. The vertical solid line indicates the frequency-dependent split of gammatone-filterbands into EC bands and BEL bands. Processing stages marked with * use the overlap-add procedure afterwards.
Current usage metrics show cumulative count of Article Views (full-text article views including HTML views, PDF and ePub downloads, according to the available data) and Abstracts Views on Vision4Press platform.
Data correspond to usage on the plateform after 2015. The current usage metrics is available 48-96 hours after online publication and is updated daily on week days.
Initial download of the metrics may take a while.