| Issue |
Acta Acust.
Volume 10, 2026
|
|
|---|---|---|
| Article Number | 10 | |
| Number of page(s) | 10 | |
| Section | Ultrasonics | |
| DOI | https://doi.org/10.1051/aacus/2026006 | |
| Published online | 25 February 2026 | |
Scientific Article
Enhanced microparticle manipulation and acoustic levitation using dual-array phased ultrasonic tweezers with advanced field control
School of Mechanical Engineering, Ningxia University, Yinchuan
750021
China
* Corresponding author: This email address is being protected from spambots. You need JavaScript enabled to view it.
Received:
24
September
2025
Accepted:
19
January
2026
Abstract
Phased-array acoustic tweezers serve as powerful tools for non-contact microparticle manipulation; however, achieving stable and repeatable three-dimensional control remains a significant challenge in physical acoustics. Here, we introduce an open-source, modular Bilateral Array ultrasonic platform designed to generate both twin and vortex acoustic fields for precise particle actuation. By integrating Arduino-based logic with a custom 16-channel MOSFET driver board, the system enables real-time phase management of 128 transducers at 40 kHz. We demonstrate that this bilateral array configuration significantly enhances acoustic focusing, manipulation accuracy, and field stability compared to traditional unilateral setups. Through rigorous experimentation, we quantify the distinct stability profiles of different field topologies generated by this system. Results indicate that while vortex fields effectively induce rotation (σθ = 2.5°), they suffer from inherent vertical instability (σz ≈ 0.10 cm), resulting in particle ejection at higher elevations. Conversely, the twin configuration demonstrates superior confinement, achieving sub-millimeter precision in both horizontal (σx ≤ 0.03 cm) and vertical (σz ≤ 0.04 cm) planes. This stability facilitates complex multi-particle operations, including the synchronized rotation of four particles and controlled merging. These findings establish quantitative design guidelines for acoustic field selection, delineating the operational trade-offs between rotational torque and axial confinement for microfluidic and biomedical applications.
Key words: Acoustic tweezers / Phased-array ultrasound / Particle manipulation / Twin field / Vortex field
© The Author(s), Published by EDP Sciences, 2026
 This is an Open Access article distributed under the terms of the Creative Commons Attribution License (https://creativecommons.org/licenses/by/4.0), which permits unrestricted use, distribution, and reproduction in any medium, provided the original work is properly cited.
1 Introduction
Acoustic radiation forces generated by structured ultrasonic fields enable the non-contact manipulation and levitation of microparticles, offering a contamination-free alternative to optical and magnetic tweezers for applications in acoustofluidics, biomedical engineering, and contactless material handling [1–8]. Among the various field topologies available, twin-focus and vortex configurations have emerged as the primary strategies for controlled translation and rotation, respectively [9–17].
Despite these advancements, a critical gap remains in the quantitative characterization of these fields under dynamic conditions. While previous studies have successfully demonstrated the capability to levitate and move particles, there is limited data regarding the comparative stability, repeatability, and positional variance of different acoustic trap geometries. Furthermore, many existing phased-array systems are proprietary or prohibitively expensive, limiting widespread experimental validation.
In this work, we address these challenges by developing a modular, open-source Bilateral Array phased transducer system operating at 40 kHz. We utilize this platform to conduct a systematic, side-by-side investigation of twin and vortex fields. Rather than simply demonstrating manipulation capability, our objective is to quantify the operational boundaries of these fields. We analyze positional standard deviations and rotational fidelity across multiple trials to determine the specific trade-offs between lateral guidance, rotational torque, and vertical confinement. This study provides the quantitative data necessary to optimize acoustic field selection for complex, multi-degree-of-freedom manipulation tasks.
2 Theoretical framework of acoustic radiation force and potential energy
The acoustic radiation force is a fundamental phenomenon that arises when ultrasound propagates through an acoustic medium and interacts with an immersed object. This force represents a secondary effect, resulting from the nonlinear response of the medium to the incident acoustic field. When ultrasound waves encounter an object, processes such as reflection, scattering, and refraction occur. During these interactions, a dynamic exchange of energy and momentum between the acoustic field and the object generates the acoustic radiation force.
For a small spherical particle suspended in an acoustic field, the acoustic radiation force can be described using the Gor’kov potential, a scalar potential U. This formalism provides a rigorous and predictive framework for analyzing particle dynamics in acoustic fields, enabling the quantitative evaluation of particle trajectories and equilibrium positions. The acoustic radiation force is given by Andrade et al. [18], Wu [19], Ozcelik et al. [20] and Shi et al. [21]
 (1)
(1)
where U represents the Gor’kov potential, which is mathematically defined as [22–24]:
![Mathematical equation: $$ \begin{aligned} U = \frac{4\pi }{3} r^3 \left[ \frac{1}{2} \left( \frac{\rho _0}{\rho _p} - 1 \right) \langle p^2 \rangle - \frac{3}{4} \left( 1 - \frac{c_0^2 \rho _0}{c_p^2 \rho _p} \right) \langle v^2 \rangle \right] \end{aligned} $$](/articles/aacus/full_html/2026/01/aacus250153/aacus250153-eq2.gif) (2)
(2)
where r is the radius of the particle, ρ 0 is the equilibrium density of the medium, ρ p is the density of the particle, c 0 is the speed of sound in the medium, c p is the speed of sound in the particle, ⟨p 2⟩ represents the time-averaged square of the acoustic pressure, and ⟨v 2⟩ represents the time-averaged square of the particle velocity.
Alternatively, the Gor’kov potential can be expressed in a simplified form using coefficients f 1 and f 2:
![Mathematical equation: $$ \begin{aligned} U = \frac{4\pi }{3} r^3 \left[ f_1 \frac{1}{2\rho _0 c_0^2} \langle p^2 \rangle - f_2 \frac{1}{\rho _0} \langle v^2 \rangle \right]. \end{aligned} $$](/articles/aacus/full_html/2026/01/aacus250153/aacus250153-eq3.gif) (3)
(3)
Here, the coefficients f 1 and f 2 are dimensionless parameters that encapsulate the physical properties of both the spherical particle and the surrounding medium. These coefficients are defined as:
 (4)
(4)
In many practical acoustic levitation experiments, the particles of interest often have densities substantially greater than that of the surrounding medium. Under these conditions, it is a reasonable approximation to assume f 1 ≈ f 2, which simplifies both the analytical and computational evaluation of acoustic radiation forces.
3 Simulation and experimental setup
3.1 Experimental apparatus and simulation environment
The foundation for all simulation and synthesis tasks in this study is a dual-layer 8 × 8 ultrasonic transducer array, comprising 128 elements in total (64 on each side) arranged in a planar configuration with a center-to-center spacing of 17.2 mm. Each transducer element (MA40S4S, Murata) has a resonant frequency of 40 kHz and operates at a peak-to-peak voltage of up to 17 Vpp. The arrays are mounted on custom 3D-printed frames to ensure precise alignment and mechanical stability, with the levitation region located at the geometric center between the two layers (z = 80 mm).
The control system orchestrating the arrays’ operation consists of an Arduino Mega 2560 and an Arduino Nano, interfaced with a dedicated 16-channel MOSFET-based driver circuit. This configuration enables independent regulation of both the phase and amplitude of each transducer element. Control signals corresponding to the desired acoustic field patterns are generated by the AcousticField3D simulation module and subsequently converted into hardware instructions. These signals are amplified via MOSFET-based circuits, producing an output voltage of up to 17 Vpp for each transducer.
A block diagram of the control architecture is shown in Figure 1. The software running on a PC calculates the required phase shift ϕi and amplitude Ai for each transducer element based on the target focal point (x, y, z) and the physical position (xi, yi, zi) of the i-th element. The emission time delay Δti for each element is precisely determined by the geometric distance di between the transducer and the target focal point, following the relationship:
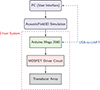 |
Figure 1. Block diagram illustrating the flow of control and data. |
 (5)
(5)
 (6)
(6)
where c is the speed of sound in air (≈343 m/s). The required phase shift ϕ i is then derived from this time delay using the fundamental wave equation:
 (7)
(7)
Assuming equal amplitude A for all elements, the total synthesized acoustic pressure at the desired focal point is the superposition of individual contributions:
 (8)
(8)
The AcousticField3D simulation engine is an integral component of the experimental framework. It provides flexible control over operational parameters, including spatial position, frequency, and phase of each transducer element. This capability enables rapid synthesis and real-time visualization of complex three-dimensional acoustic fields, offering detailed insight into their behavior and characteristics.
The driver board design is based on an Arduino Mega, which generates 64 digital periodic signals with the phase and amplitude defined by the computer. A shield amplifies these signals up to 17 Vpp using dual-driver MOSFETs (TC4427, Microchip). For higher channel counts, multiple boards can be chained together; in our setup, two boards are used per array layer, totaling four boards for the full 128-element system. A sync signal, generated by the first board at 40 kHz, is shared among all chained boards to ensure precise timing and avoid beating effects.
The software allows users to define array geometries, simulate acoustic fields in real time, and control the connected driver boards. It supports predefined beamforming operations such as focusing, twin-trap generation, and vortex field creation, as well as the manual adjustment of phase and amplitude for exploration. Once the user defines the array geometry and selects a beamforming operation, the software calculates the phase and amplitude for each transducer and generates the control signals required for the driver boards. A simple automatic protocol assigns physical channels to transducers: a small microphone transducer (MA40S4S) is placed on top of each array element in sequence, and the software emits a test signal until the correct channel is detected. This eliminates the need for manual wiring verification.
Communication between the PC and the driver boards is handled via USB-to-UART at 250 KBaud. The Arduino receives commands using its integrated UART chip, and a simple 8-bit protocol allows the addition of emission patterns to the buffer, specification of durations, or switching of buffers. The maximum supported steps per period at 40 kHz is ten, giving a phase resolution of π/5. Up to 32 complete voltage patterns can be stored in memory, enabling dynamic field modulation without continuous PC communication. Figure 2 shows a schematic of the driver circuit for one channel. The TC4427 dual MOSFET driver amplifies the 5 Vpp logic signal from the Arduino to 17 Vpp, sufficient to drive the transducers. Decoupling capacitors (100 nF and 4.7 μF) ensure stable power delivery. The circuit also distributes the sync signal and UART data amongst all chained boards.
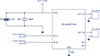 |
Figure 2. Dual-channel driver module using TC4427 MOSFET drivers (5 V → 17 Vpp). Replicated 64 times to drive all 128 transducers in the bilateral array. |
This open, modular platform, combining readily available electronics (Arduino, MOSFETs) with custom 3D-printed mechanics, provides a reproducible, low-cost solution for researchers to explore advanced acoustic manipulation techniques, including multi-particle control and complex field shaping.
3.2 Generation and characterization of acoustic traps
To generate precisely controlled acoustic traps at the phase center, a transducer array was employed to create various trapping patterns – including single-focus, twin-focus, and vortex configurations – through careful modulation of phase delays. A comparative analysis of the absolute total acoustic pressure and acoustic radiation force profiles for Unilateral Array and Bilateral Array configurations demonstrated the superior performance of the Bilateral Array system in terms of field confinement and stability.
Quantitative calculations, derived from the analyses presented in Figures 3 and 4, further support these observations. For the unilateral planar array, the maximum absolute total acoustic pressure at the focal point was measured at 829.6 Pa, corresponding to a maximum acoustic radiation force of approximately 0.096 nN. In comparison, the bilateral planar array exhibited a marked improvement, achieving a maximum pressure of 2136.6 Pa and a radiation force of 0.549 nN at the focal point.
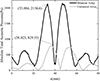 |
Figure 3. Absolute total acoustic pressure profiles of the twin acoustic field at the focal point. The bilateral array (black line) achieves a peak pressure of 2136.6 Pa, while the unilateral array (grey line) reaches 829.6 Pa. Units: mm, Pa. |
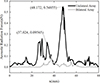 |
Figure 4. Acoustic radiation force profiles of the twin acoustic field. The bilateral array generates a significantly stronger trapping force (peak ≈0.55 nN) compared to the unilateral array (peak ≈0.10 nN), demonstrating the non-linear enhancement of force with respect to pressure. Units: mm, nN. |
The significant enhancement observed in the bilateral planar system is attributed to two fundamental mechanisms. First, the inclusion of acoustic array doubles the number of acoustic sources, naturally increasing the total energy input. More critically, unlike the unilateral array which primarily generates a traveling wave, the bilateral configuration establishes a high-intensity standing wave field. By rigorously calibrating the distance between the opposing arrays to be an integer multiple of the half-wavelength (n λ/2, where n ∈ ℕ), acoustic resonance is induced within the cavity. This constructive interference leads to a substantial amplification of the acoustic pressure amplitude (approximately 2.6-fold). Since the acoustic radiation force scales with the square of the acoustic pressure (F rad ∝ p 2), this pressure amplification translates into a nearly 5.7-fold increase in the magnitude of the trapping force. Consequently, the bilateral array configuration provides significantly stronger field gradients and particle confinement compared to Unilateral array setups, underpinning the high stability observed in our experimental manipulation.
The pressure distribution profile reveals a pronounced peak in absolute total pressure, indicating the formation of a stable acoustic potential well – an essential feature for effective particle trapping. The generation of a single-focus acoustic trap relies on precise control of both the phase and amplitude of the waves emitted by each transducer element. By exploiting wave interference, localized acoustic radiation force potential wells are established at the targeted location. Near the focal point, the pressure gradient stabilizes, producing a potential minimum that facilitates the efficient trapping of microparticles. Figure 5 illustrates the acoustic field characteristics at the focal point (0, 0, 80) mm, including the absolute total pressure distribution, the acoustic radiation force profile, and the corresponding acoustic pressure isosurface.
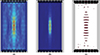 |
Figure 5. Focused acoustic field generated by a planar array at the focal point (0, 0, 80) mm. (a) Absolute total acoustic pressure. (b) Acoustic radiation force. (c) Acoustic pressure isosurface. All panels show front-view (x–z plane) cross-sections. Units: mm. |
The twin-focus acoustic field is generated by creating two adjacent pressure nodes with a phase difference of π between them. This is achieved through precise modulation of both the phase and amplitude of the transducer array, resulting in two out-of-phase foci. Such a configuration is particularly advantageous for applications including microparticle separation, interaction studies, and dynamic manipulation.
Figures 6a–6e present front-view (x–z plane) cross-sections of the twin-focus acoustic field, showing acoustic pressure isosurface, acoustic pressure, absolute total pressure, acoustic radiation force, and phase distribution, respectively. The corresponding top-view (x–y plane) cross-sections are displayed in Figures 6f–6j, confirming the field’s uniformity and symmetry at the focal plane. Notably, the symmetric force distribution in Figures 6d and 6i highlights the high stability of the focal region, while the phase distributions in Figures 6e and 6j demonstrate the required π phase difference for twin focusing.
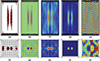 |
Figure 6. Twin-focus acoustic field at (0, 0, 80) mm: spatial distribution in front-view (panels a–e) and top-view (panels f–j) planes. (a, f) Acoustic pressure isosurface. (b, g) Acoustic pressure. (c, h) Absolute total pressure. (d, i) Acoustic radiation force. (e, j) Phase distribution. Units: mm. |
By carefully controlling the phase distribution across the transducer array, an acoustic field carrying orbital angular momentum can be established. This results in a ring-shaped acoustic radiation potential well, with a central pressure node where the acoustic amplitude approaches zero. Such a configuration is particularly effective for controlled particle capture and rotational manipulation. The acoustic pressure in this vortex field forms a distinct spiral pattern, with the central node encircled by a high-intensity ring-shaped region.
Figure 7 presents a detailed visualization of the vortex acoustic field at the focal point (0, 0, 80) mm. Panels (a)–(d) show front-view (x–z plane) cross-sections: (a) acoustic pressure isosurface, (b) acoustic radiation force, (c) absolute total pressure, and (d) phase distribution. The corresponding top-view (x–y plane) cross-sections are displayed in panels (e)–(h), confirming the field’s characteristic spiral symmetry. Notably, the concentric force distribution in Figure 7bb and the radial phase gradient in Figure 7d highlight the field’s suitability for stable rotational control, while the uniform top-view patterns in Figures 7e–7h underscore its predictability for particle manipulation.
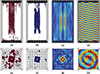 |
Figure 7. Vortex acoustic field at (0, 0, 80) mm: spatial distribution in front-view (panels a–d) and top-view (panels e–h) planes. (a, e) Acoustic pressure isosurface. (b, f) Acoustic radiation force. (c, g) Absolute total pressure. (d, h) Phase distribution. Units: mm. |
3.2.1 Dynamic control of acoustic traps: rotation and translation
By carefully adjusting the symmetric phase partitioning of the transducer array elements and employing real-time dynamic control of the excitation phases, the distribution of the acoustic field can be gradually and precisely modified. This advanced control strategy enables the controlled rotation and translation of trapped samples within the acoustic potential well, providing a robust tool for intricate microparticle manipulation.
Figure 8 illustrates the twin sound field at two rotational states: 0° and 45°. Panels (a)–(d) show the field at 0° rotation: (a) transducer phase, (b) phase distribution, (c) absolute total pressure, and (d) acoustic pressure. Panels (e)–(h) show the same parameters at 45° rotation. Maintaining a symmetric phase distribution is essential for ensuring a stable and uniform acoustic field throughout the rotational process. Precise phase control preserves the stability and uniformity of the field, while targeted adjustments based on symmetric partitioning allow accurate and reproducible rotational manipulation of the acoustic trap.
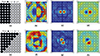 |
Figure 8. Twin sound field at 0° (panels a–d) and 45° (panels e–h) rotation. (a, e) Transducer phase. (b, f) Phase distribution. (c, g) Absolute total pressure. (d, h) Acoustic pressure. All panels: Top-view. Units: mm. |
3.2.2 Axial translation of acoustic traps
Axial translation of the acoustic trap along the z-axis was achieved by dynamically varying the focal position. Absolute pressure maps at various focal depths z = 40, 60, 80, 100, 120 mm are presented in Figure 9. These visualizations clearly demonstrate precise control of the acoustic trap along the axial direction, with the focal region remaining stable and centered across all depths.
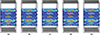 |
Figure 9. Axial cross-sectional absolute total pressure maps of the vortex acoustic field at focal depths z = 40, 60, 80, 100, 120 mm. (a)–(e): Front-view cross-sections showing stable focal region at each depth. Units: mm. Red circles highlight the focal point. |
Horizontal translation of the acoustic trap at a fixed axial height of 80 mm was also successfully realized. Pressure distributions corresponding to lateral focal positions at ( − 10, 10), (10, 10), ( − 10, −10), (10, −10) mm are shown in Figure 10, along with the activation states of the transducer elements (black indicating active, white indicating inactive). The data from Figure 10 further illustrate precise lateral control of the acoustic trap. By selectively activating transducer elements, stable low-potential wells are created, enabling accurate horizontal translation while maintaining particle confinement. Together, the axial and horizontal control strategies provide robust manipulation of the acoustic trap in three-dimensional space.
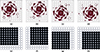 |
Figure 10. Vortex sound field for lateral positioning at ( ± 10, ±10) mm: Top-view (panels a–d) and transducer activation (panels e–h). (a, d) Focused 3D sound pressure at ( − 10, 10) and (10, −10). (b, c) Focused 3D sound pressure at (10, 10) and ( − 10, −10). (e, h) Selected transducer arrays (black = enabled, white = disabled). Units: mm. |
4 Acoustic particle manipulation experiment
This section presents the experimental validation of the theoretical models and simulation results, highlighting the practical application of phased-array acoustic tweezers for microparticle manipulation. The experiments were specifically designed to demonstrate the effectiveness of twin and vortex acoustic fields in controlling both the rotation and translation of particles.
4.1 Rotational manipulation of particles using vortex acoustic fields
Controlled particle rotation is a key requirement for advanced microparticle manipulation. By precisely regulating the phase and spatial distribution of the transducer array elements, an acoustic field capable of inducing stable rotational motion was generated. For these experiments, polyethylene foam particles with a diameter of 2.5 mm were levitated within the acoustic field produced by the Bilateral Array system. Precise phase modulation was employed to achieve stable levitation while enabling controlled particle rotation.
To quantify the stability of the induced rotation, we performed seven repeated trials at a fixed phase shift of 90°, tracking the instantaneous angular position of the particle over five full rotations. The standard deviation of the angular deviation from the ideal circular path was calculated to be σ θ = 2.5 ° ±0.3°, indicating moderate rotational stability under dynamic phase control. This value reflects the inherent trade-off between rotational torque and trapping stiffness in vortex-systems.
Figure 11 illustrates the experimental setup and corresponding observations of particle rotation under different phase shifts applied to the transducers. Panels (a)–(d) show the effect of phase angles of 0 ° ,45 ° ,90 ° , and 135° on the particle’s rotational behavior. At an initial phase angle of 0°, the particle exhibits a nearly circular trajectory, indicative of stable trapping. As the phase angle is gradually increased to 135°, the trajectory transitions into a conical path, reflecting the dynamic control afforded by the system. The corresponding simulation results, shown in panels (e)–(h), are in close agreement with the experimental data, confirming that the observed rotational dynamics are directly correlated with the applied acoustic phase shifts.
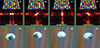 |
Figure 11. Experimental particle rotation. (a)–(d) Simulated pressure fields at phase shifts 0 ° ,45 ° ,90 ° ,135°. (e)–(h) Experimental images of a rotating polyethylene particle (2.5 mm). |
4.2 Twin acoustic particle manipulation
The twin acoustic method enables highly precise, non-contact particle manipulation by leveraging phase-controlled transducer arrays to generate localized acoustic potential wells. Through the strategic modulation of both phase distribution and transducer spatial arrangement, stable trapping nodes are engineered to guide particles along predetermined translational trajectories in 3D space, extending beyond spontaneous rotation to enable programmable, deterministic motion.
To quantify the accuracy and repeatability of this control, we performed seven repeated trials under identical experimental conditions (same particle type, initial position, and acoustic field profile) for both horizontal (x-axis) and vertical (z-axis) translation. The results demonstrate sub-millimeter precision and high reproducibility across all tested positions.
Particles were guided to target positions at 0.8 cm, 1.6 cm, and 2.4 cm from the origin. Measured displacements were 0.79 ± 0.02 cm, 1.58 ± 0.02 cm, and 2.37 ± 0.03 cm, respectively. The close alignment between measured values and ideal targets confirms exceptional fidelity in lateral motion.
Similarly, particles were manipulated along the z-axis to positions 0.8 cm, 1.6 cm, and 2.4 cm. Measured displacements were 0.76 ± 0.04 cm, 1.56 ± 0.04 cm, and 2.36 ± 0.04 cm. This demonstrates consistent performance in the vertical direction, despite the added challenge of gravity compensation (Fig. 12).
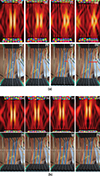 |
Figure 12. Twin acoustic particle manipulation in horizontal and vertical planes. (a) Horizontal motion (x-axis): (a)–(d) Simulated acoustic fields at target positions: (0.0, 0.0, 0.0), (0.8, 0.0, 0.0), (1.6, 0.0, 0.0), and (2.4, 0.0, 0.0) cm. (e)–(h) Corresponding experimental results showing particle trajectories. Measured displacements: 0.79 cm, 1.58 cm, 2.37 cm. (b) Vertical motion (z-axis): (a)–(d) Simulated fields at (0.0, 0.0, 0.0), (0.0, 0.0, 0.8), (0.0, 0.0, 1.6), and (0.0, 0.0, 2.4) cm. (e)–(h) Experimental results. Measured displacements: 0.76 cm, 1.56 cm, 2.36 cm. |
These results demonstrate that the twin acoustic system provides not only reliable levitation and controlled motion but also statistically robust, repeatable performance across multiple spatial dimensions. The strong agreement between simulation and experiment, combined with the low variability quantified here, validates the system’s suitability for applications requiring high-precision, multi-axis particle manipulation such as micro-assembly, cell sorting, or contactless material handling (Fig. 13).
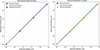 |
Figure 13. Quantified repeatability of twin particle translation. Left: Horizontal (x-axis) motion. Right: Vertical (z-axis) motion. Blue/green dots: mean measured position (n = 7 trials). Dashed line: ideal desired position. Red/orange squares: standard deviation error bars. All axes in cm. |
4.3 Vortex acoustic particle manipulation
Vortex acoustic fields offer a powerful mechanism for contactless particle manipulation, particularly suited for guiding particles along lateral trajectories. However, our experimental investigations reveal inherent limitations in vertical stability, which must be characterized for practical applications.
To quantify this behavior, we performed seven repeated trials under identical conditions for both horizontal (x-axis) and vertical (z-axis) translation using a single polyethylene foam particle. The results demonstrate that while vortex fields enable precise horizontal control, they exhibit significant vertical drift under dynamic manipulation.
Particles were guided to target positions at 0.8 cm, 1.6 cm, and 2.4 cm from the origin. Measured displacements were 0.79 ± 0.02 cm, 1.58 ± 0.02 cm, and 2.37 ± 0.03 cm, respectively. These values show excellent agreement with ideal targets (Fig. 14a), confirming that vortex fields provide sub-millimeter precision for lateral motion.
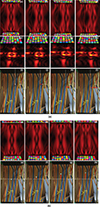 |
Figure 14. Vortex acoustic particle manipulation in horizontal and vertical planes. (a) Horizontal motion (x-axis): (a)–(d) Simulated acoustic fields at target positions: (0.0, 0.0, 0.0), (0.8, 0.0, 0.0), (1.6, 0.0, 0.0), and (2.4, 0.0, 0.0) cm. (e)–(h) Corresponding experimental results showing particle trajectories. Measured displacements: 0.79 cm, 1.58 cm, 2.37 cm. (b) Vertical motion (z-axis): (a)–(d) Simulated fields at (0.0, 0.0, 0.0), (0.0, 0.0, 0.8), (0.0, 0.0, 1.6), and (0.0, 0.0, 2.4) cm. (e)–(h) Experimental results. Measured displacements: 0.75 cm, 1.54 cm, 2.34 cm. |
In contrast, vertical manipulation revealed notable instability. While particles could be displaced to 0.8 cm, 1.6 cm, and 2.4 cm with measured values of 0.75 ± 0.10 cm, 1.54 ± 0.10 cm, and 2.34 ± 0.10 cm (Fig. 14b), the large standard deviation (σz = 0.10 cm) reflects consistent vertical fluctuations of approximately ±0.10 cm during motion. This drift intensified beyond 1.6 cm, often leading to particle loss from levitation. These findings indicate that vortex fields are less effective for applications requiring stringent vertical confinement or the handling of heavier particles, where stable z-axis trapping is critical (Fig. 15).
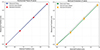 |
Figure 15. Precision and instability limits of vortex-based particle translation. Left: Horizontal (x-axis) motion. Right: Vertical (z-axis) motion. Blue/green dots: mean position (n = 7). Dashed line: ideal target. Red/orange squares: ± standard deviation. All axes in cm. Data show high x-axis precision (σ ≤ 0.03 cm) and pronounced z-axis instability (σ = 0.10 cm), defining the operational boundary of vortex fields. |
Collectively, these results establish a clear operational boundary for vortex-based manipulation: it excels in horizontal guidance but faces fundamental challenges in maintaining vertical stability. This characterization provides essential guidance for future system design and application selection.
4.4 Rotational stability of a four-particle array
To quantitatively assess the robustness of trajectory and rotational control in complex manipulation tasks, we conducted a stability analysis on a four-particle system configured at the vertices of a rectangle and rotated about its geometric center. The experiments employed polyethylene foam particles with a diameter of 2 mm. Rotational manipulation was executed in 15° increments, up to a total rotation of 45°, as depicted in the physical setups and corroborated by acoustic field simulations (Fig. 16).
 |
Figure 16. Independent control and rotational stability of four particles. (a)–(d) Physical diagrams showing particle positions during clockwise rotation around the rectangle’s center: (a) 0°, (b) 15°, (c) 30°, (d) 45°. (e)–(h) Corresponding acoustic field simulations: (e) 0°, (f) 15°, (g) 30°, (h) 45°. Panels (a)–(d) show top-down views of the experimental setup. Panels (e)–(h) show simulated pressure amplitude fields (color scale: red = high pressure, black = low pressure), with green dots indicating target focal positions. |
The instantaneous orientation of each particle was tracked relative to its ideal rotational trajectory. For each particle, the angular deviation Δθ(t) from the ideal path was continuously calculated throughout the rotation. The standard deviation of this angular deviation, denoted as σ θ , was used as a quantitative measure of rotational stability. Over ten repeated trials under identical experimental conditions, the mean standard deviation across all particles was σ θ = 1.0 ° ±0.15°, demonstrating high fidelity in angular control. Additionally, the maximum positional error in the radial direction remained below 0.12 mm for all rotations, indicating minimal perturbation due to inter-particle acoustic interactions. These results confirm that the vortex acoustic field configuration facilitates both independent actuation and stable, coherent rotation of multiple particles with high positional and angular precision.
4.5 Controlled particle merging via acoustic field modulation
We conducted a controlled particle merging experiment to evaluate the system’s capability for precise multi-particle manipulation. Two polyethylene foam particles were initially positioned at ( − 2.4, 0.0, 0.0) cm and (2.4, 0.0, 0.0) cm within the acoustic chamber. By real-time modulation of the phase profile across the transducer array, the dual acoustic foci were gradually converged along the x-axis, guiding the particles toward a common central location at (0.0, 0.0, 0.0) cm.
The merging process was documented in four sequential stages, as shown in Figure 17: (a) initial separation ±2.4 cm, (b) approach to ±1.6 cm, (c) approach to ±0.8 cm, and (d) complete coalescence at the central position (0.0, 0.0, 0.0) cm. Simulated sound pressure fields (Figs. 17e–17h) closely matched the particle trajectories observed in the physical experiments (Figs. 17a–17d), with a mean tracking error of 0.09 mm across all stages. Notably, during the final approach phase (inter-particle distance < 1 mm), a weak acoustic attraction attributable to secondary radiation forces was detected; however, this effect was fully compensated by the adaptive control algorithm, ensuring continuous and stable convergence.
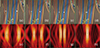 |
Figure 17. Controlled merging of two particles via dynamic acoustic field modulation. (a)–(d) Front-view experimental images at key stages: (a) initial positions ( − 2.4, 0.0, 0.0) cm and (2.4, 0.0, 0.0) cm; (b) at ( − 1.6, 0.0, 0.0) cm and (1.6, 0.0, 0.0) cm; (c) at ( − 0.8, 0.0, 0.0) cm and (0.8, 0.0, 0.0) cm; (d) merged at (0.0, 0.0, 0.0) cm. (e)–(h) Corresponding front-view acoustic field simulations showing pressure amplitude, with green dots indicating focal points. |
5 Discussion
The experimental results highlight a fundamental functional dichotomy between the twin and vortex acoustic field configurations. The divergence in vertical stability versus rotational capability is of particular significance. The vortex field proves highly effective for generating torque, successfully transferring orbital angular momentum to manipulated objects. This capability was clearly demonstrated not only by the rotation of a single particle but also by the synchronized rotation of a four-particle array. However, this rotational efficiency comes at the expense of axial stiffness; the lack of a strong central pressure gradient along the z-axis results in a “leaky” trap. This explains the pronounced vertical fluctuations and particle loss observed during the vortex-based elevation tasks (Sect. 4.3), limiting the utility of vortex fields to planar manipulation or scenarios where robust lift is not the primary requirement.
In contrast, the twin configuration creates a closed potential well with high gradients in all three dimensions. The constructive interference of the dual beams provides the “pincer-like" confinement necessary for robust 3D translation, as evidenced by the four-fold improvement in vertical stability compared to the vortex field. This structural robustness is essential for operations requiring high positional precision rather than continuous rotation, such as the controlled particle merging demonstrated in this study. While the twin trap offers superior holding forces, the vortex trap remains the optimal choice for orientation control.
Furthermore, the close agreement between our numerical simulations and experimental trajectories validates the phase-control algorithm used in our custom hardware. The ability to independently manipulate a four-particle array using vortex fields, and subsequently merge particles using twin fields, suggests that the Bilateral Array geometry effectively minimizes cross-talk and secondary scattering effects, which are common sources of instability in Unilateral Array levitators.
6 Conclusion
This study presents a comprehensive quantitative evaluation of phased-array acoustic tweezers, establishing clear operational boundaries for microparticle manipulation. We demonstrated that while vortex fields provide effective rotational control, they are inherently limited by vertical instability, making them unsuitable for tasks requiring significant axial lifting. The twin configuration emerged as the superior topology for precise 3D control, offering robust confinement and high repeatability for translational operations.
Additionally, the validation of our open-source, modular hardware platform confirms that high-precision acoustic levitation is achievable with accessible components, democratizing access to this technology. By providing a rigorous comparison of field stabilities, this work offers actionable design guidelines: vortex fields should be reserved for planar rotation, while twin traps are essential for applications requiring stable, three-dimensional spatial positioning. These insights advance the engineering of acoustic tweezers for next-generation applications in micro-assembly and biomedical instrumentation.
Funding
The authors gratefully acknowledge support for this work from National Natural Science Foundation of China (12232013, 52265015).
Conflict of interest
Zhang Bo reports financial support was provided by National Natural Science Foundation of China (12232013, 52265015). Other authors declare that they have no known competing financial interests or personal relationships that could have appeared to influence the work reported in this paper.
Data availability statement
The research data associated with this article are included within the article.
References
- K. Dholakia, P. Reece: Optical micromanipulation takes hold. Nano Today 1 (2006) 18–27. [Google Scholar]
- Y. Feng, K.N. Brazin, E. Kobayashi, R.J. Mallis, E.L. Reinherz, M.J. Lang: Mechanosensing drives acuity of T-cell recognition. Proceedings of the National Academy of Sciences 114 (2017) E8204–E8213. [Google Scholar]
- A. Ashkin, J.M. Dziedzic, T. Yamane: Optical trapping and manipulation of single cells using infrared laser beams. Nature 330 (1987) 769–771. [Google Scholar]
- J. Guck, R. Ananthakrishnan, H. Mahmood, T.J. Moon, C.C. Cunningham, J. Käs: The optical stretcher: a novel laser tool to micromanipulate cells. Biophysical Journal 81 (2001) 767–784. [Google Scholar]
- K. Dholakia, B.W. Drinkwater, M. Ritsch-Marte: Comparing acoustic and optical forces for biomedical research. Nature Reviews Physics 2 (2020) 480–491. [Google Scholar]
- Z. Zhang, D. Ahmed: Light-driven high-precision cell adhesion kinetics. Light: Science & Applications 11 (2022) 266. [Google Scholar]
- Y. Shi, S. Xiong, L.K. Chin, J. Zhang, W. Ser, J. Wu, T. Chen, Z. Yang, Y. Hao, B. Liedberg, P.H. Yap: Nanometer-precision linear sorting with synchronized optofluidic dual barriers. Science Advances 4 (2018) eaao0773. [Google Scholar]
- Y. Shi, S. Xiong, Y. Zhang, L.K. Chin, Y.Y. Chen, J.B. Zhang, T.H. Zhang, W. Ser, A. Larrson, S.H. Lim, J.H. Wu: Sculpting nanoparticle dynamics for single-bacteria-level screening and direct binding-efficiency measurement. Nature Communications 9 (2018) 815. [Google Scholar]
- J. Shi, D. Ahmed, X. Mao, S.C.S. Lin, A. Lawit, T.J. Huang: Acoustic tweezers: patterning cells and microparticles using standing surface acoustic waves (SSAW). Lab on a Chip 9 (2009) 2890–2895. [Google Scholar]
- J. Nilsson, M. Evander, B. Hammarström, T. Laurell: Review of cell and particle trapping in microfluidic systems. Analytica Chimica Acta 649 (2009) 141–157. [Google Scholar]
- X. Ding, S.C.S. Lin, B. Kiraly, H. Yue, S. Li, I.K. Chiang, J. Shi, S.J. Benkovic, T.J. Huang: On-chip manipulation of single microparticles, cells, and organisms using surface acoustic waves. Proceedings of the National Academy of Sciences 109 (2012) 11105–11109. [Google Scholar]
- L.Y. Yeo, J.R. Friend: Surface acoustic wave microfluidics. Annual Review of Fluid Mechanics 46 (2014) 379–406. [Google Scholar]
- A. Ozcelik, J. Rufo, F. Guo, Y. Gu, P. Li, J. Lata, T.J. Huang: Acoustic tweezers for the life sciences. Nature Methods 15 (2018) 1021–1028. [Google Scholar]
- A. Marzo, A. Barnes, B.W. Drinkwater: Tinylev: a multi-emitter single-axis acoustic levitator. Review of Scientific Instruments 88 (2017). [Google Scholar]
- A. Marzo, S.A. Seah, B.W. Drinkwater, D.R. Sahoo, B. Long, S. Subramanian: Holographic acoustic elements for manipulation of levitated objects. Nature Communications 6 (2015) 8661. [Google Scholar]
- A. Marzo, B.W. Drinkwater: Holographic acoustic tweezers. Proceedings of the National Academy of Sciences 116 (2019) 84–89. [Google Scholar]
- A. Marzo, M. Caleap, B.W. Drinkwater: Acoustic virtual vortices with tunable orbital angular momentum for trapping of Mie particles. Physical Review Letters 120 (2018) 044301. [Google Scholar]
- M.A.B. Andrade, T.S.A. Camargo, A. Marzo: Automatic contactless injection, transportation, merging, and ejection of droplets with a multifocal point acoustic levitator. Review of Scientific Instruments 89, 12 (2018) 125105. [Google Scholar]
- J.R. Wu: Acoustical tweezers. The Journal of the Acoustical Society of America 90, 1 (1991) 395–414. [Google Scholar]
- A. Ozcelik, J. Rufo, F. Guo, Y. Gu, P. Li, J. Lata, T.J. Huang: Acoustic tweezers for the life sciences. Nature Methods 15, 12 (2018) 1021–1028. [Google Scholar]
- J.J. Shi, D. Ahmed, X. Mao, S.C.S. Lin, A. Lawit, T.J. Huang: Acoustic tweezers: patterning cells and microparticles using standing surface acoustic waves (SSAW). Lab on a Chip 9, 20 (2009) 2890–2895. [Google Scholar]
- L.P. Gor’kov, On the forces acting on a small particle in an acoustical field in an ideal fluid, in: Selected Papers of Lev P. Gor’kov, 2014, pp. 315–317. [Google Scholar]
- M.A.B. Andrade, N. Perez, J.C. Adamowski: Review of progress in acoustic levitation. Brazilian Journal of Physics 48, 3 (2018) 190–213. [Google Scholar]
- L.V. King: On the acoustic radiation pressure on spheres. Proceedings of the Royal Society of London. Series A, Mathematical and Physical Sciences 147, 861 (1934) 212–240. [Google Scholar]
Cite this article as: Al-Hajj A. Zhou J. Zhang B. Qin Y. & Xu J. 2026. Enhanced microparticle manipulation and acoustic levitation using dual-array phased ultrasonic tweezers with advanced field control. Acta Acustica, 10, 10. https://doi.org/10.1051/aacus/2026006.
All Figures
|
Figure 1. Block diagram illustrating the flow of control and data. |
| In the text | |
|
Figure 2. Dual-channel driver module using TC4427 MOSFET drivers (5 V → 17 Vpp). Replicated 64 times to drive all 128 transducers in the bilateral array. |
| In the text | |
|
Figure 3. Absolute total acoustic pressure profiles of the twin acoustic field at the focal point. The bilateral array (black line) achieves a peak pressure of 2136.6 Pa, while the unilateral array (grey line) reaches 829.6 Pa. Units: mm, Pa. |
| In the text | |
|
Figure 4. Acoustic radiation force profiles of the twin acoustic field. The bilateral array generates a significantly stronger trapping force (peak ≈0.55 nN) compared to the unilateral array (peak ≈0.10 nN), demonstrating the non-linear enhancement of force with respect to pressure. Units: mm, nN. |
| In the text | |
|
Figure 5. Focused acoustic field generated by a planar array at the focal point (0, 0, 80) mm. (a) Absolute total acoustic pressure. (b) Acoustic radiation force. (c) Acoustic pressure isosurface. All panels show front-view (x–z plane) cross-sections. Units: mm. |
| In the text | |
|
Figure 6. Twin-focus acoustic field at (0, 0, 80) mm: spatial distribution in front-view (panels a–e) and top-view (panels f–j) planes. (a, f) Acoustic pressure isosurface. (b, g) Acoustic pressure. (c, h) Absolute total pressure. (d, i) Acoustic radiation force. (e, j) Phase distribution. Units: mm. |
| In the text | |
|
Figure 7. Vortex acoustic field at (0, 0, 80) mm: spatial distribution in front-view (panels a–d) and top-view (panels e–h) planes. (a, e) Acoustic pressure isosurface. (b, f) Acoustic radiation force. (c, g) Absolute total pressure. (d, h) Phase distribution. Units: mm. |
| In the text | |
|
Figure 8. Twin sound field at 0° (panels a–d) and 45° (panels e–h) rotation. (a, e) Transducer phase. (b, f) Phase distribution. (c, g) Absolute total pressure. (d, h) Acoustic pressure. All panels: Top-view. Units: mm. |
| In the text | |
|
Figure 9. Axial cross-sectional absolute total pressure maps of the vortex acoustic field at focal depths z = 40, 60, 80, 100, 120 mm. (a)–(e): Front-view cross-sections showing stable focal region at each depth. Units: mm. Red circles highlight the focal point. |
| In the text | |
|
Figure 10. Vortex sound field for lateral positioning at ( ± 10, ±10) mm: Top-view (panels a–d) and transducer activation (panels e–h). (a, d) Focused 3D sound pressure at ( − 10, 10) and (10, −10). (b, c) Focused 3D sound pressure at (10, 10) and ( − 10, −10). (e, h) Selected transducer arrays (black = enabled, white = disabled). Units: mm. |
| In the text | |
|
Figure 11. Experimental particle rotation. (a)–(d) Simulated pressure fields at phase shifts 0 ° ,45 ° ,90 ° ,135°. (e)–(h) Experimental images of a rotating polyethylene particle (2.5 mm). |
| In the text | |
|
Figure 12. Twin acoustic particle manipulation in horizontal and vertical planes. (a) Horizontal motion (x-axis): (a)–(d) Simulated acoustic fields at target positions: (0.0, 0.0, 0.0), (0.8, 0.0, 0.0), (1.6, 0.0, 0.0), and (2.4, 0.0, 0.0) cm. (e)–(h) Corresponding experimental results showing particle trajectories. Measured displacements: 0.79 cm, 1.58 cm, 2.37 cm. (b) Vertical motion (z-axis): (a)–(d) Simulated fields at (0.0, 0.0, 0.0), (0.0, 0.0, 0.8), (0.0, 0.0, 1.6), and (0.0, 0.0, 2.4) cm. (e)–(h) Experimental results. Measured displacements: 0.76 cm, 1.56 cm, 2.36 cm. |
| In the text | |
|
Figure 13. Quantified repeatability of twin particle translation. Left: Horizontal (x-axis) motion. Right: Vertical (z-axis) motion. Blue/green dots: mean measured position (n = 7 trials). Dashed line: ideal desired position. Red/orange squares: standard deviation error bars. All axes in cm. |
| In the text | |
|
Figure 14. Vortex acoustic particle manipulation in horizontal and vertical planes. (a) Horizontal motion (x-axis): (a)–(d) Simulated acoustic fields at target positions: (0.0, 0.0, 0.0), (0.8, 0.0, 0.0), (1.6, 0.0, 0.0), and (2.4, 0.0, 0.0) cm. (e)–(h) Corresponding experimental results showing particle trajectories. Measured displacements: 0.79 cm, 1.58 cm, 2.37 cm. (b) Vertical motion (z-axis): (a)–(d) Simulated fields at (0.0, 0.0, 0.0), (0.0, 0.0, 0.8), (0.0, 0.0, 1.6), and (0.0, 0.0, 2.4) cm. (e)–(h) Experimental results. Measured displacements: 0.75 cm, 1.54 cm, 2.34 cm. |
| In the text | |
|
Figure 15. Precision and instability limits of vortex-based particle translation. Left: Horizontal (x-axis) motion. Right: Vertical (z-axis) motion. Blue/green dots: mean position (n = 7). Dashed line: ideal target. Red/orange squares: ± standard deviation. All axes in cm. Data show high x-axis precision (σ ≤ 0.03 cm) and pronounced z-axis instability (σ = 0.10 cm), defining the operational boundary of vortex fields. |
| In the text | |
|
Figure 16. Independent control and rotational stability of four particles. (a)–(d) Physical diagrams showing particle positions during clockwise rotation around the rectangle’s center: (a) 0°, (b) 15°, (c) 30°, (d) 45°. (e)–(h) Corresponding acoustic field simulations: (e) 0°, (f) 15°, (g) 30°, (h) 45°. Panels (a)–(d) show top-down views of the experimental setup. Panels (e)–(h) show simulated pressure amplitude fields (color scale: red = high pressure, black = low pressure), with green dots indicating target focal positions. |
| In the text | |
|
Figure 17. Controlled merging of two particles via dynamic acoustic field modulation. (a)–(d) Front-view experimental images at key stages: (a) initial positions ( − 2.4, 0.0, 0.0) cm and (2.4, 0.0, 0.0) cm; (b) at ( − 1.6, 0.0, 0.0) cm and (1.6, 0.0, 0.0) cm; (c) at ( − 0.8, 0.0, 0.0) cm and (0.8, 0.0, 0.0) cm; (d) merged at (0.0, 0.0, 0.0) cm. (e)–(h) Corresponding front-view acoustic field simulations showing pressure amplitude, with green dots indicating focal points. |
| In the text | |
Current usage metrics show cumulative count of Article Views (full-text article views including HTML views, PDF and ePub downloads, according to the available data) and Abstracts Views on Vision4Press platform.
Data correspond to usage on the plateform after 2015. The current usage metrics is available 48-96 hours after online publication and is updated daily on week days.
Initial download of the metrics may take a while.