


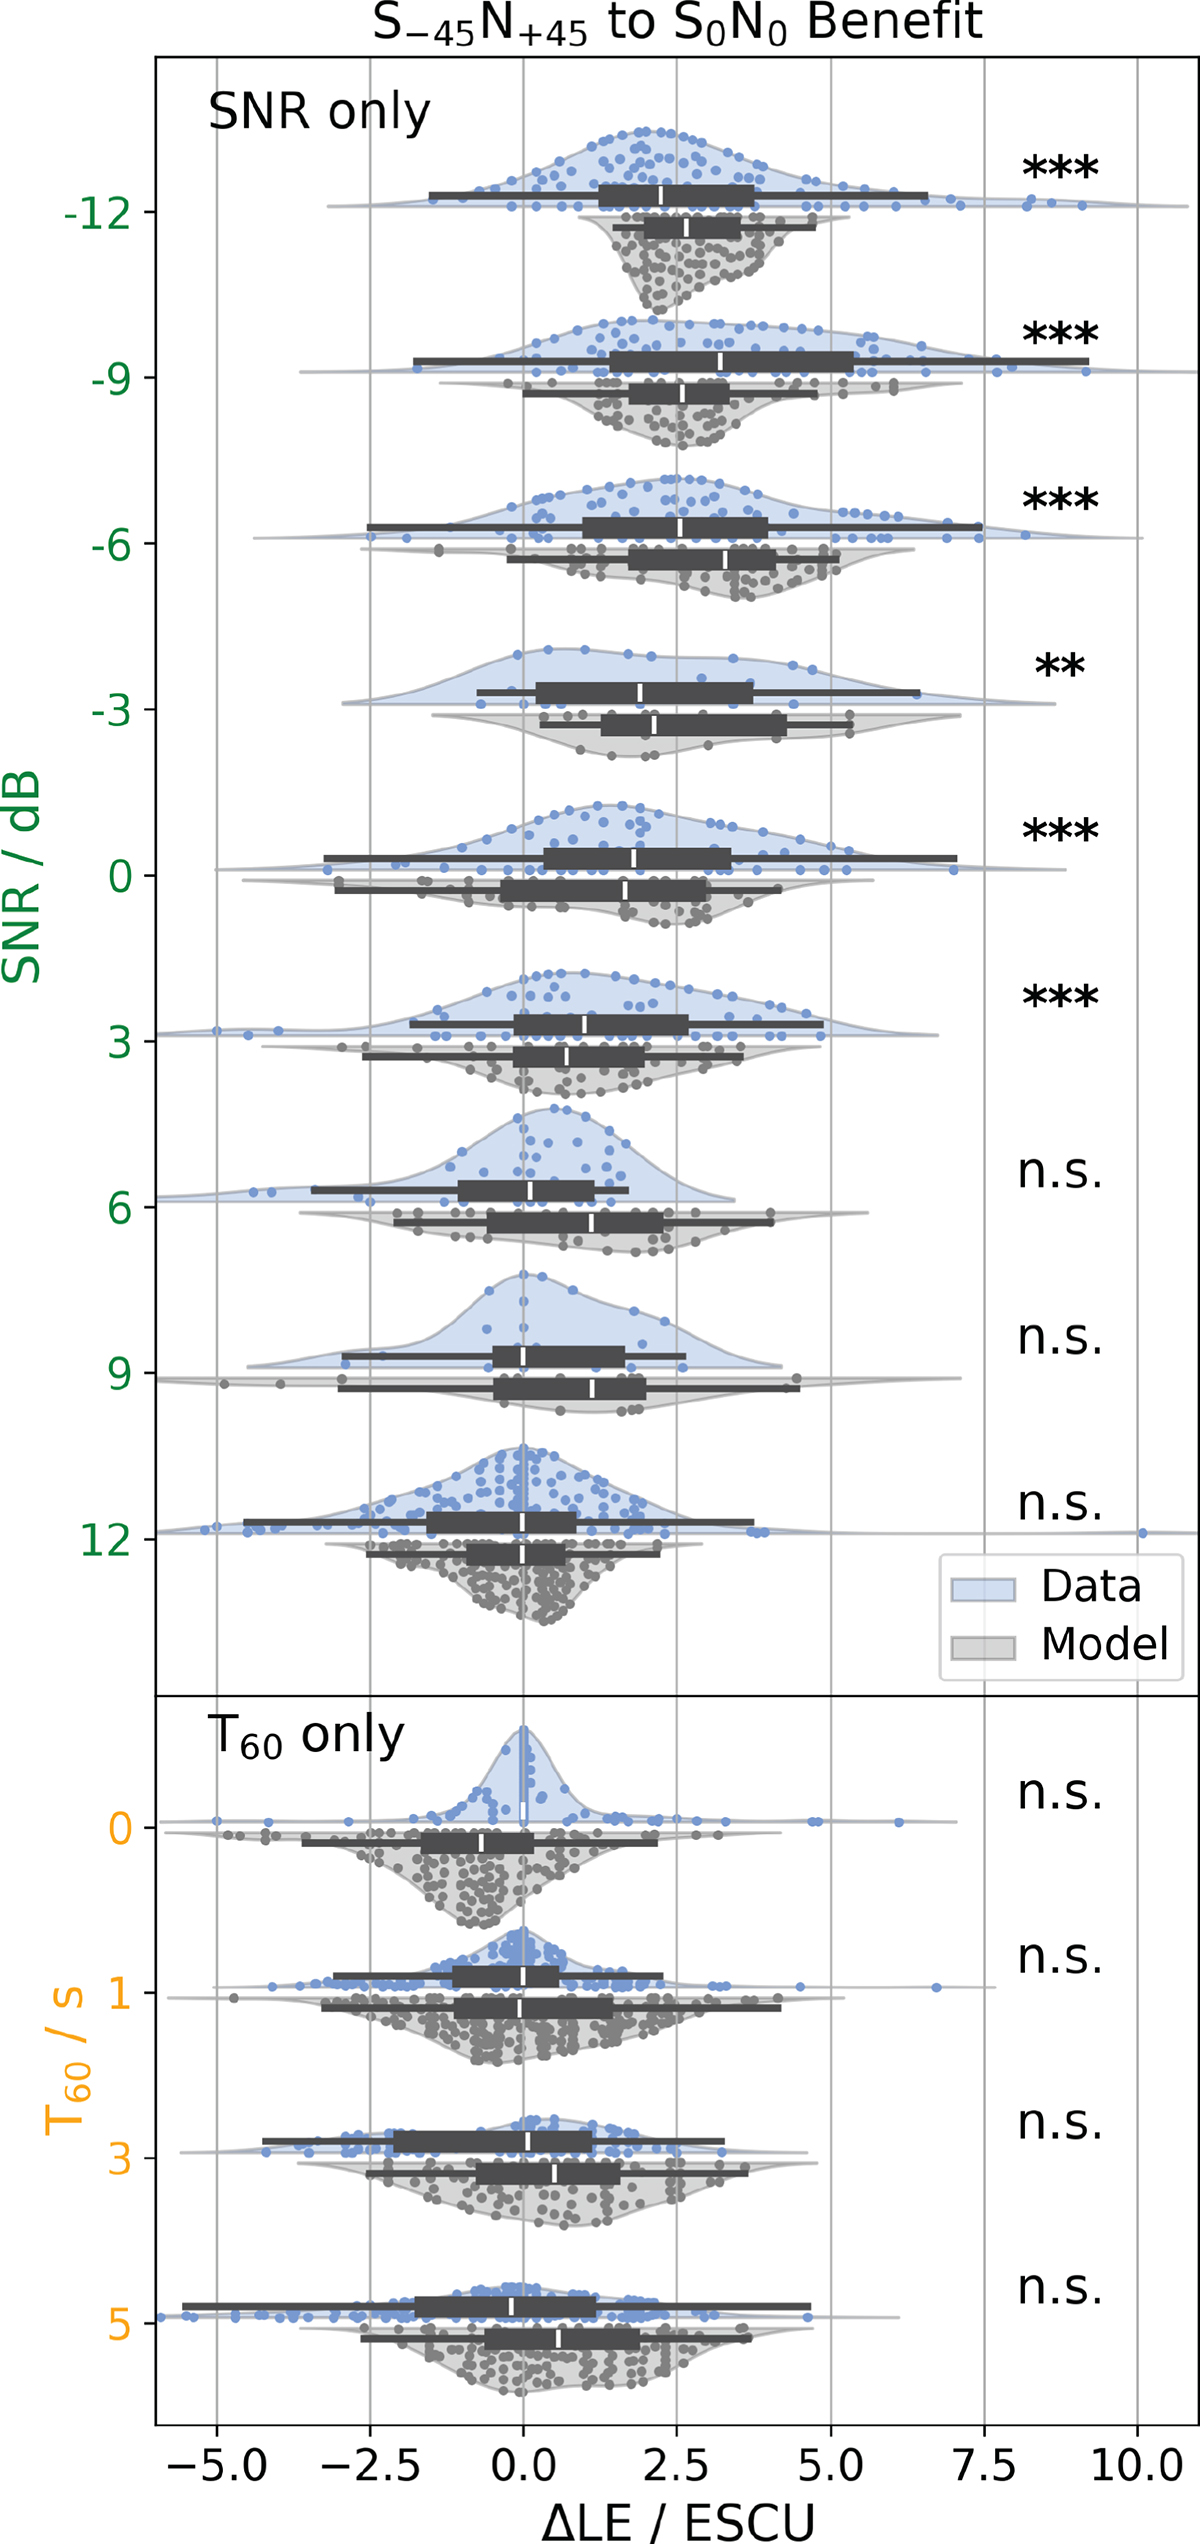
Figure 8.
Download original image
Spatial release ΔLE for participants (blue) and the model (gray) due to lateralization of sound sources for the SNR only (upper panel) and T60 only (lower panel) profiles visualized as violin plots with box plots. Distributions are grouped by SNR and T60 values, respectively. Underlying data points are plotted as dots inside the violin shapes. Black boxes display IQRs, where the median is indicated as a white line inside. Whiskers are added as black lines. Note that for the T60 only profile and a T60 of 0 s no box and whiskers were drawn since most data points are at 0 ESCU. Significant release of LE in the subjective data is indicated with *, ** and *** for significancy levels of α = 0.05, α = 0.01 and α = 0.001, respectively.
Current usage metrics show cumulative count of Article Views (full-text article views including HTML views, PDF and ePub downloads, according to the available data) and Abstracts Views on Vision4Press platform.
Data correspond to usage on the plateform after 2015. The current usage metrics is available 48-96 hours after online publication and is updated daily on week days.
Initial download of the metrics may take a while.