


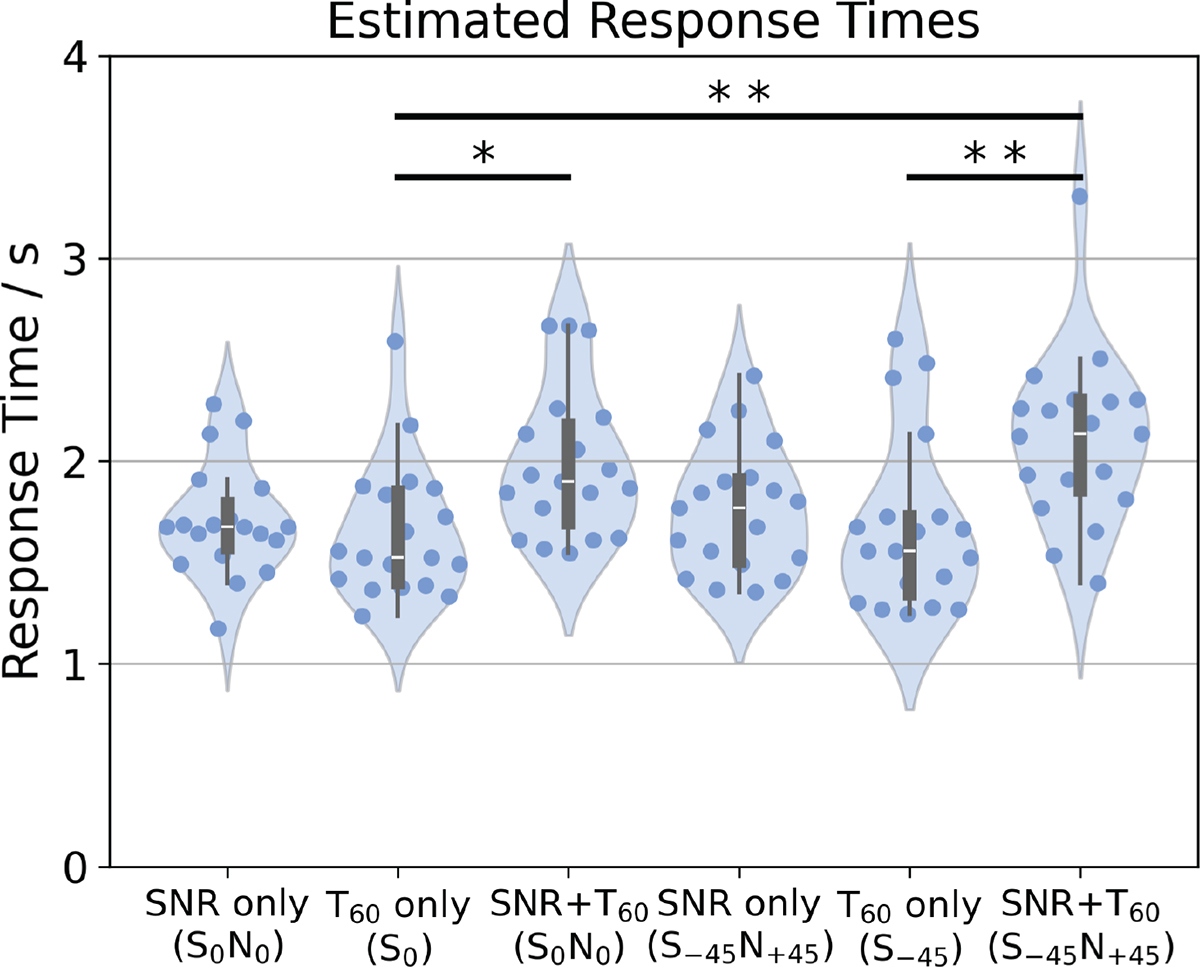
Figure 9.
Download original image
Distribution of estimated response times in seconds for all six profiles displayed as violin plots. Underlying data points are plotted as dots inside the violin shapes. Significant differences between distributions are indicated with * and ** for Bonferroni corrected significancy levels of α = 0.05 and α = 0.01, respectively.
Current usage metrics show cumulative count of Article Views (full-text article views including HTML views, PDF and ePub downloads, according to the available data) and Abstracts Views on Vision4Press platform.
Data correspond to usage on the plateform after 2015. The current usage metrics is available 48-96 hours after online publication and is updated daily on week days.
Initial download of the metrics may take a while.