Figure 2.
Download original image
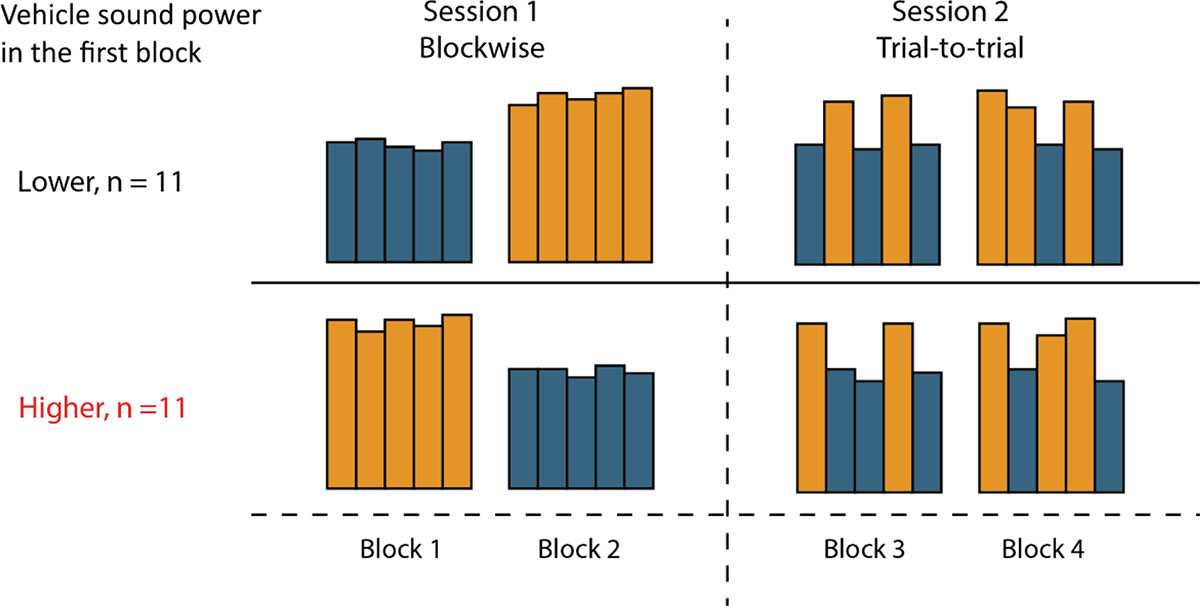
Graphical illustration of blocks presented in each session. Bars represent individual trials, and the bar height represents the actual vehicle sound power (including the comparably small variability between trials in the same vehicle sound power condition due to e.g., differing speeds). The orange and blue bars indicate trials presenting the higher (audio gain 10 dB) and lower vehicle sound power (audio gain 0 dB), respectively. All participants started with the blockwise vehicle sound power variation. Half of the participants started with the lower sound power and the other half started with the higher sound power. In the second session, the higher and lower sound powers were presented interleaved (trial-to-trial power variation).
Current usage metrics show cumulative count of Article Views (full-text article views including HTML views, PDF and ePub downloads, according to the available data) and Abstracts Views on Vision4Press platform.
Data correspond to usage on the plateform after 2015. The current usage metrics is available 48-96 hours after online publication and is updated daily on week days.
Initial download of the metrics may take a while.