Figure 3.
Download original image
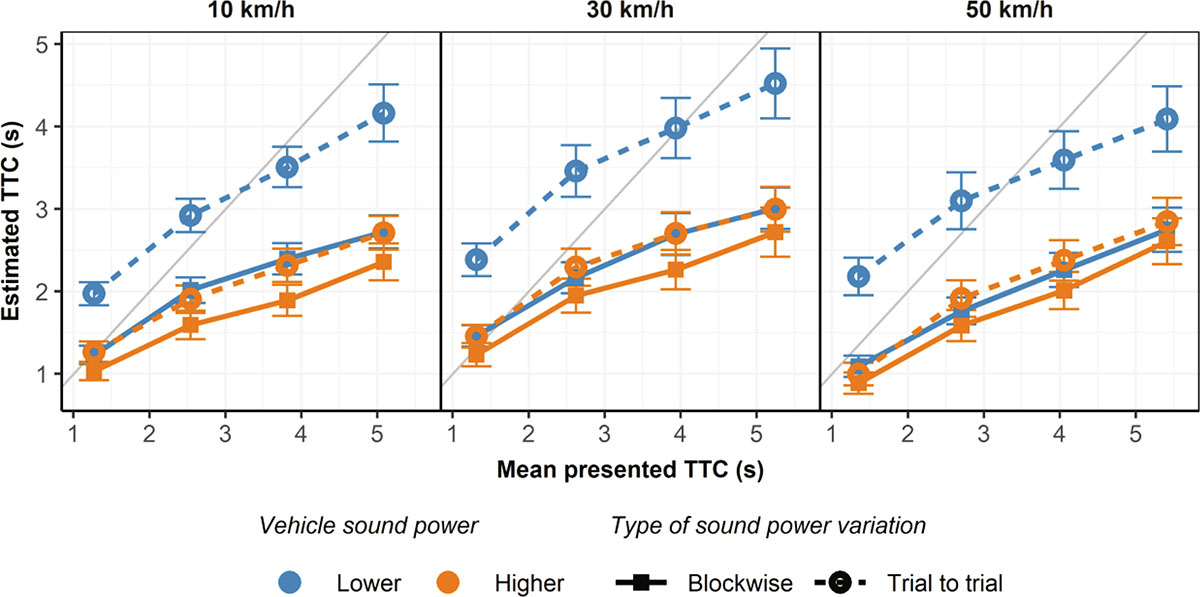
Mean estimated TTC as a function of the mean presented TTC. The different colors represent the two vehicle sound powers, with the higher sound power (audio gain 10 dB) presented in orange and the lower (audio gain 0 dB) in blue. The symbols and line types indicate the type of sound power variation, with circles and dotted lines corresponding to the trial-to-trial variation and squares and solid lines corresponding to the blockwise variation. The panels correspond to the three different velocities. Error bars show ±1 standard error of the mean across the 22 participants.
Current usage metrics show cumulative count of Article Views (full-text article views including HTML views, PDF and ePub downloads, according to the available data) and Abstracts Views on Vision4Press platform.
Data correspond to usage on the plateform after 2015. The current usage metrics is available 48-96 hours after online publication and is updated daily on week days.
Initial download of the metrics may take a while.