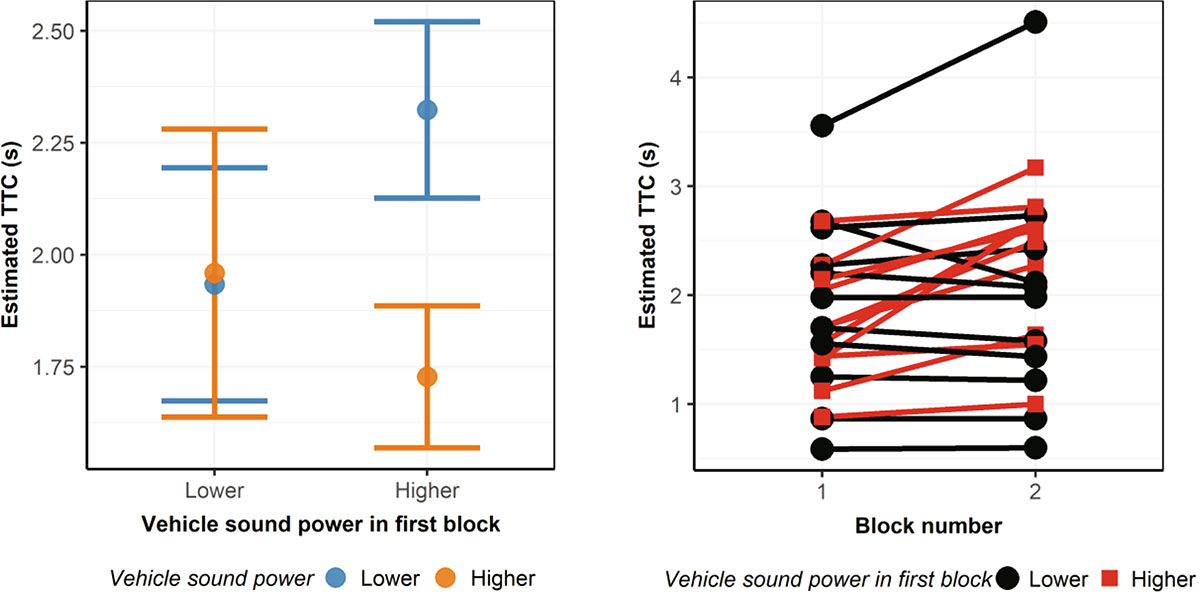
Figure 4.
Download original image
This figure only shows only data from the first session, in which the vehicle sound power was varied in a blockwise fashion. The left panel shows the mean estimated TTC as a function of the vehicle sound power presented in the first block that participants completed. Half of the 22 participants started with the block presenting the lower sound power (n = 11) and the other half with the higher sound power (n = 11). The colors indicate the vehicle sound power (orange = higher sound power, blue = lower sound power). Error bars show ±1 standard error of the mean (SEM). The right panel shows, for each participant, how the mean estimated TTC changed between their first and second block. The colors here indicate the sound power in the first block that participants completed (black = lower sound power presented in block 1, red = higher sound power presented in block 1).
Current usage metrics show cumulative count of Article Views (full-text article views including HTML views, PDF and ePub downloads, according to the available data) and Abstracts Views on Vision4Press platform.
Data correspond to usage on the plateform after 2015. The current usage metrics is available 48-96 hours after online publication and is updated daily on week days.
Initial download of the metrics may take a while.