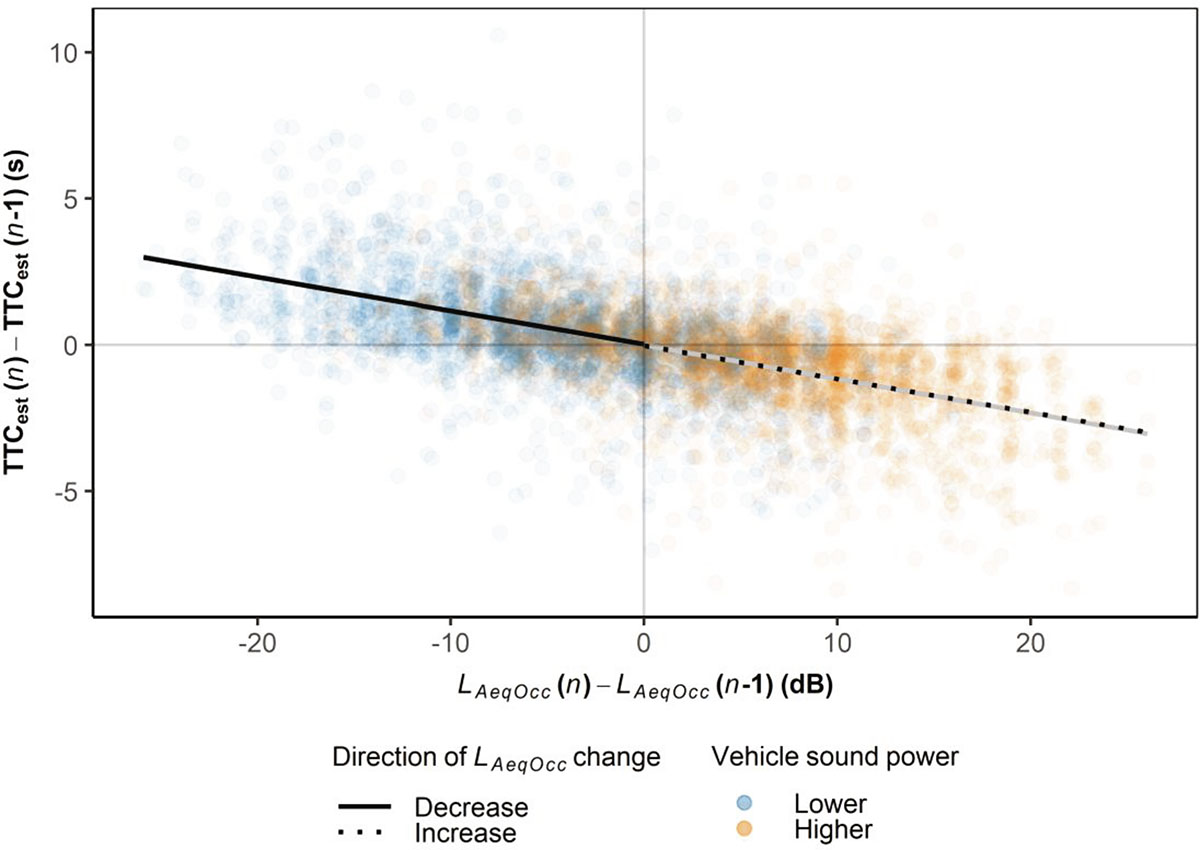
Figure 5.
Download original image
The change in estimated TTC as a function of the change in LAeqOcc on a given trial n, relative to the TTC and LAeqOcc presented on the preceding trial n − 1, in the blocks with trial-to-trial variation in sound power. The changes were calculated between pairs of consecutive trials. The colors of the individual datapoints show the vehicle sound power of trial n. The solid black regression line was fitted based on data from pairs of trials with a decrease in LAeqOcc (LAeqOcc(n)< LAeqOcc(n − 1)). The dashed black regression line was fitted based on data from pairs of trials with an increase in LAeqOcc(LAeqOcc(n)≥LAeqOcc(n − 1)). Lastly, the gray regression line was fitted to all trials from the condition with trial-to-trial sound power variation.
Current usage metrics show cumulative count of Article Views (full-text article views including HTML views, PDF and ePub downloads, according to the available data) and Abstracts Views on Vision4Press platform.
Data correspond to usage on the plateform after 2015. The current usage metrics is available 48-96 hours after online publication and is updated daily on week days.
Initial download of the metrics may take a while.