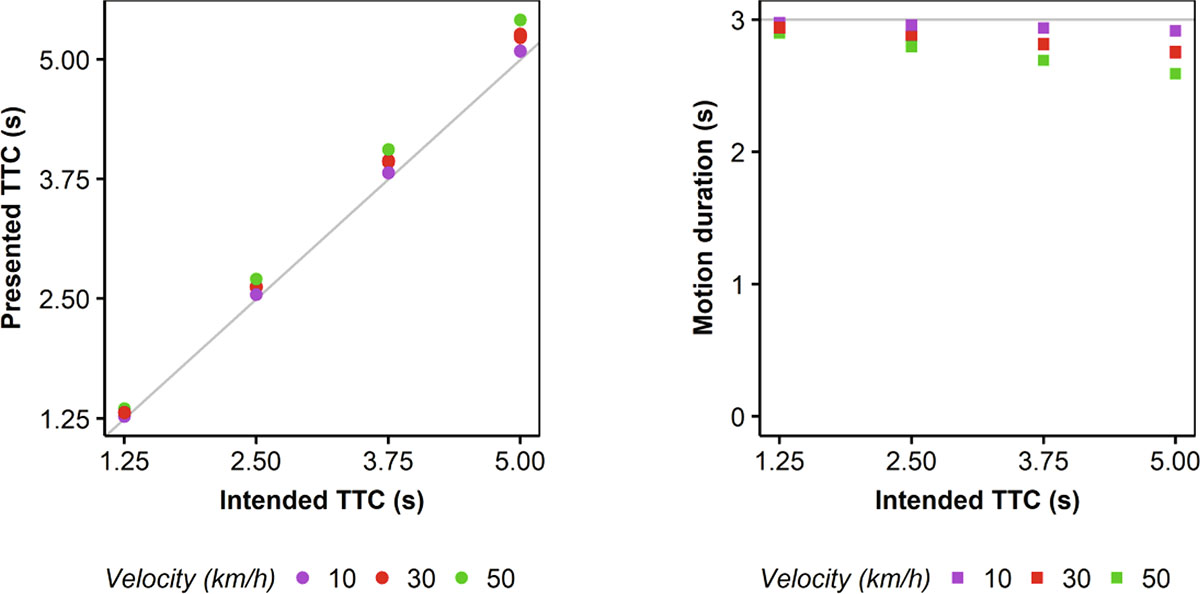
Figure A.1.
Download original image
Left panel: Scatter plot of the presented TTC at occlusion as a function of the intended TTC, across all trials presented in the experiment. The presented TTC was always slightly longer than the intended TTC (indicated by the diagonal). Purple: vehicle speed 10 km/h. Red: 30 km/h. Green: 50 km/h. Right panel: Scatterplot of the presented motion duration as a function of intended TTC. The intended duration of 3 s is indicated by the gray horizontal line.
Current usage metrics show cumulative count of Article Views (full-text article views including HTML views, PDF and ePub downloads, according to the available data) and Abstracts Views on Vision4Press platform.
Data correspond to usage on the plateform after 2015. The current usage metrics is available 48-96 hours after online publication and is updated daily on week days.
Initial download of the metrics may take a while.