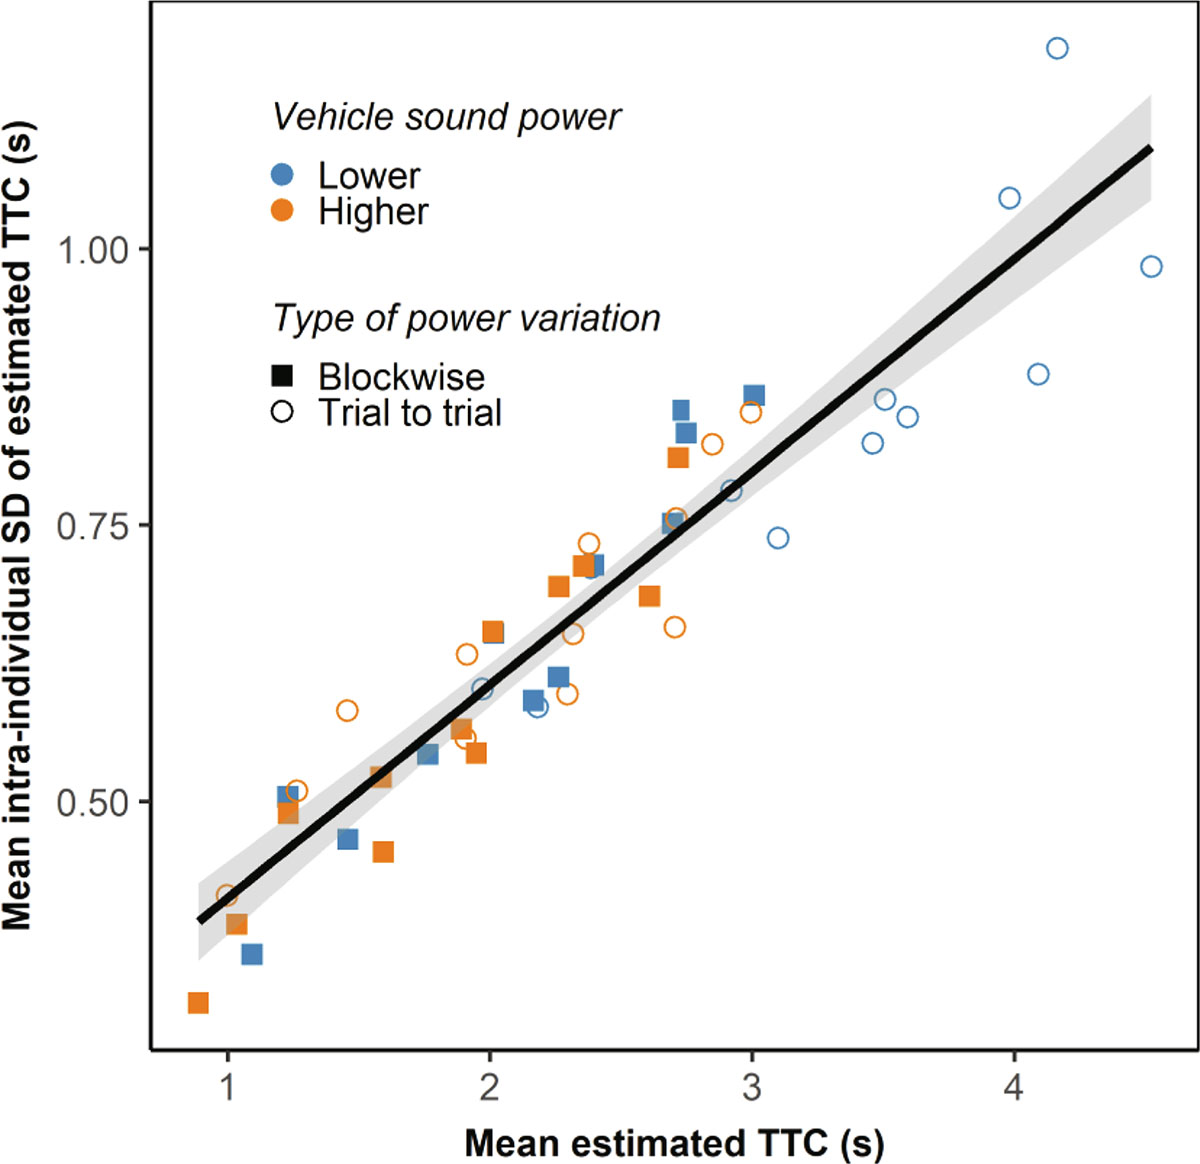
Figure A.2.
Download original image
Mean of the intra-individual standard deviation of the estimated TTCs, plotted as a function of the mean estimated TTC. Each data point corresponds to one of the experimental conditions (i.e., unique combinations of TTC, velocity, vehicle sound power, and type of power variation; same as the data points plotted in Fig. 3). Orange symbols: higher sound power. Blue symbols: lower sound power. Filled squares: blockwise source-power variation. Open circles: trial-to-trial power variation. The black line shows the best-fitting linear regression line, SD(TTCest)=0.22 s + 0.19 M(TTCest), R2 = 0.89.
Current usage metrics show cumulative count of Article Views (full-text article views including HTML views, PDF and ePub downloads, according to the available data) and Abstracts Views on Vision4Press platform.
Data correspond to usage on the plateform after 2015. The current usage metrics is available 48-96 hours after online publication and is updated daily on week days.
Initial download of the metrics may take a while.