Figure 3.
Download original image
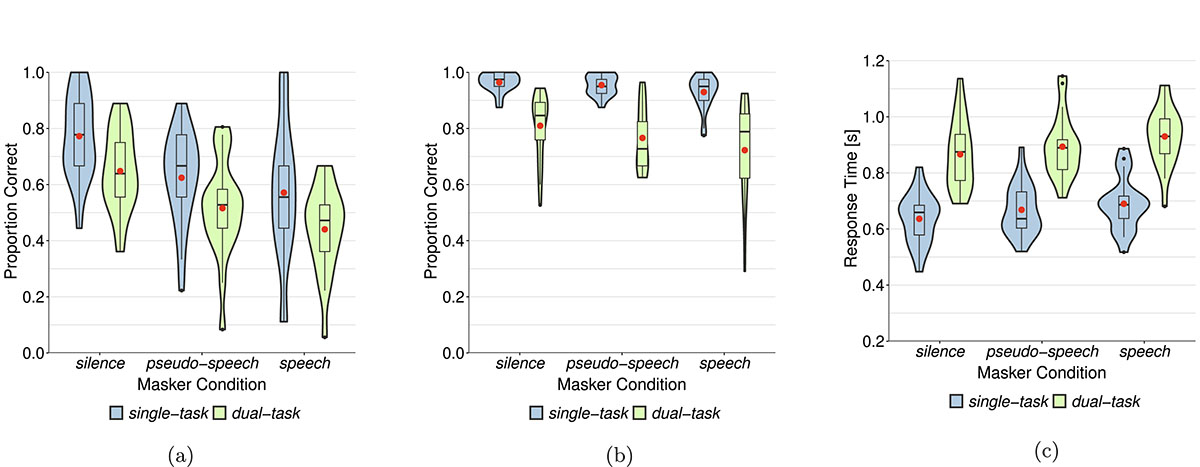
Results of the (a) primary HTR task, (b) secondary vibrotactile task, and (c) response times in the secondary vibrotactile task. Proportion correct (for the primary and secondary vibrotactile task) and accumulated response times in seconds (for the secondary vibrotactile task) are plotted as a function of the masker condition (silence, pseudo-speech, speech) and the number of tasks (single-task, dual-task), averaged per participant. The boxes represent the interquartile ranges, while the median is indicated with a horizontal line and the mean with a red circle.
Current usage metrics show cumulative count of Article Views (full-text article views including HTML views, PDF and ePub downloads, according to the available data) and Abstracts Views on Vision4Press platform.
Data correspond to usage on the plateform after 2015. The current usage metrics is available 48-96 hours after online publication and is updated daily on week days.
Initial download of the metrics may take a while.