Figure 7.
Download original image
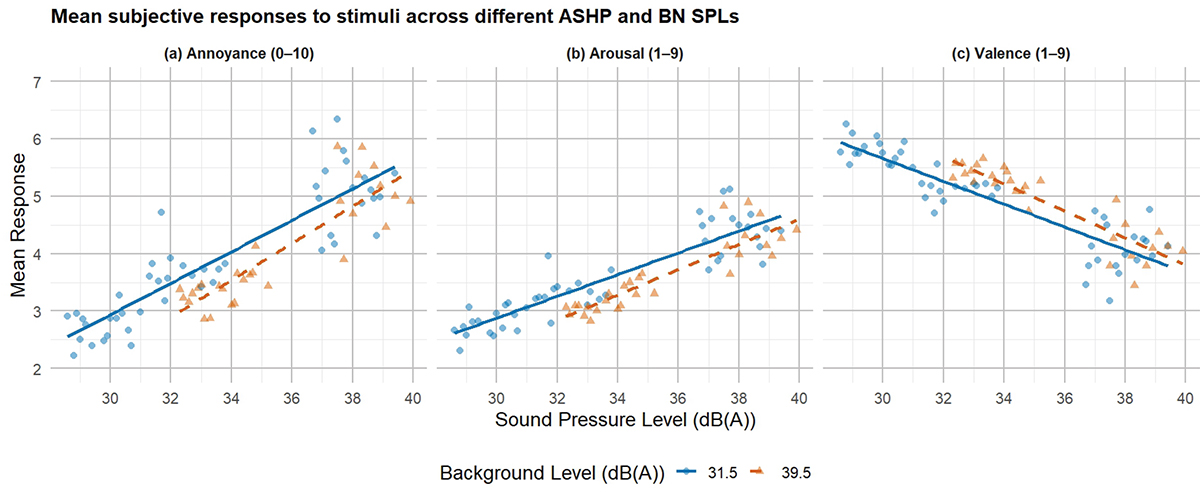
Mean subjective responses ((a) Annoyance, (b) Arousal, and (c) Valence) as a function of combined ASHP and BN sound pressure levels at the listener’s position, shown separately for BN levels of 31.5 dB(A) and 39.5 dB(A). Points indicate mean responses at each sound level; lines show linear trend fits. Responses were rated on different scales (Annoyance: 0–10; Valence and Arousal: 1–9) but are plotted on a common y-axis for alignment, and are restricted to the range covering the observed data for clarity.
Current usage metrics show cumulative count of Article Views (full-text article views including HTML views, PDF and ePub downloads, according to the available data) and Abstracts Views on Vision4Press platform.
Data correspond to usage on the plateform after 2015. The current usage metrics is available 48-96 hours after online publication and is updated daily on week days.
Initial download of the metrics may take a while.