Open Access
Figure 6.
Download original image
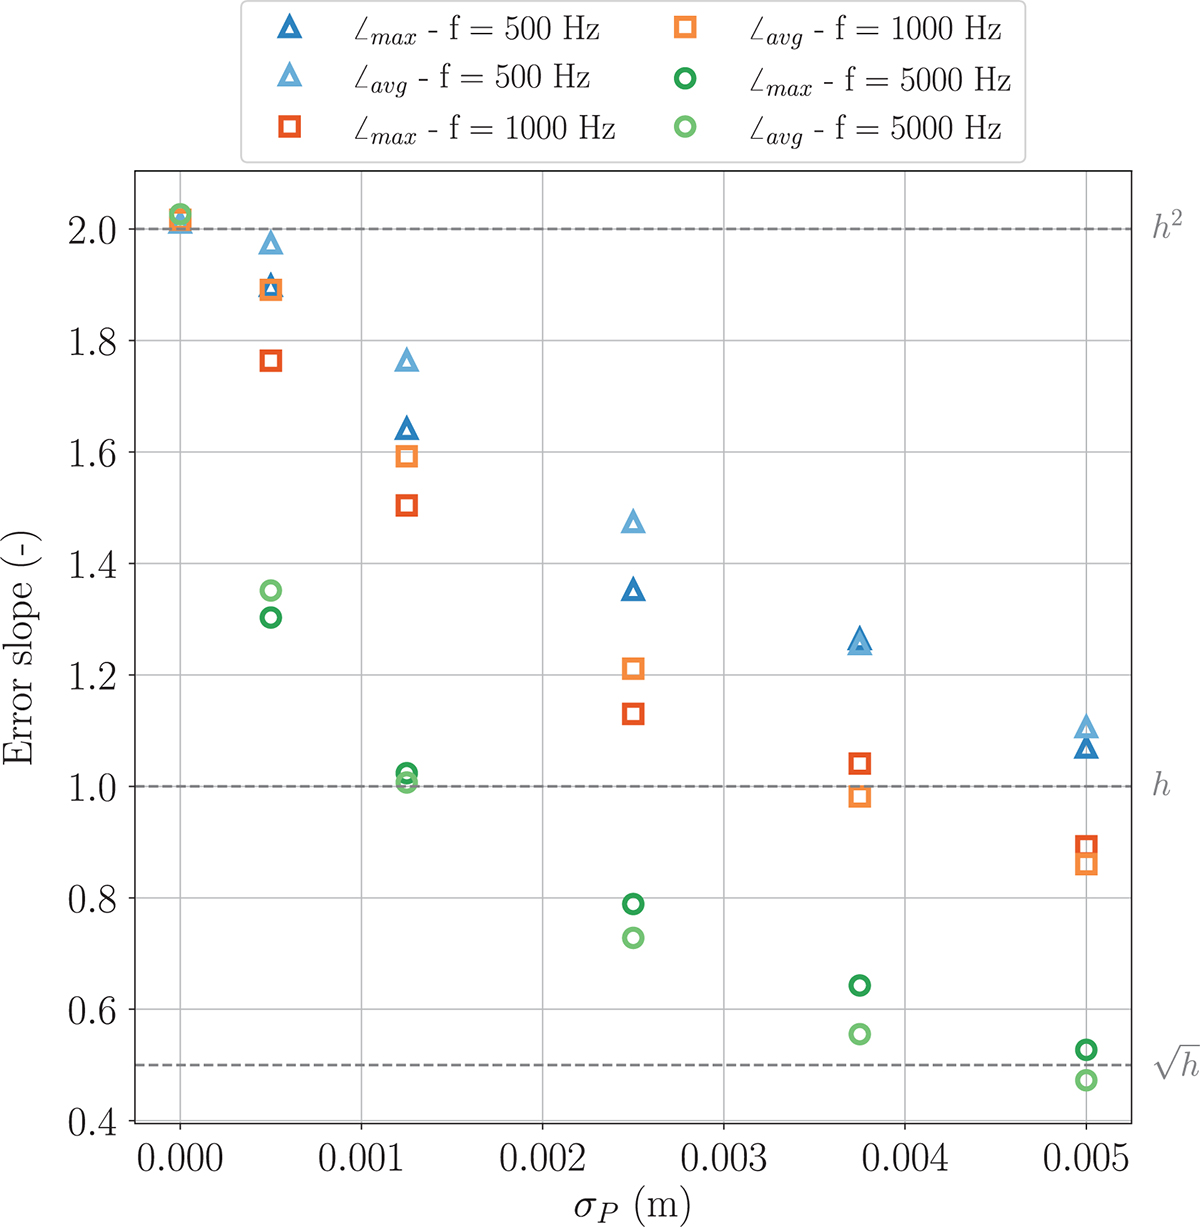
Evolution of the average slope value of the highest and average reconstruction error curves with respect to the mesh size, for measurements performed with increasing values of σ P . The dashed lines represent the corresponding quadratic, linear and sublinear trends.
Current usage metrics show cumulative count of Article Views (full-text article views including HTML views, PDF and ePub downloads, according to the available data) and Abstracts Views on Vision4Press platform.
Data correspond to usage on the plateform after 2015. The current usage metrics is available 48-96 hours after online publication and is updated daily on week days.
Initial download of the metrics may take a while.