| Issue |
Acta Acust.
Volume 10, 2026
|
|
|---|---|---|
| Article Number | 38 | |
| Number of page(s) | 11 | |
| Section | Hearing, Audiology and Psychoacoustics | |
| DOI | https://doi.org/10.1051/aacus/2026038 | |
| Published online | 19 May 2026 | |
Scientific Article
Adapting the EC model to the frequency dependency of binaural masking level differences – Is this relevant for speech in noise?
Carl von Ossietzky Universität Oldenburg, Department für Medizinische Physik und Akustik and Cluster of Excellence “Hearing4all.connects”, 26129, Oldenburg, Germany
* Corresponding author: This email address is being protected from spambots. You need JavaScript enabled to view it.
Received:
30
October
2025
Accepted:
8
April
2026
Abstract
Several binaural speech intelligibility models simulate human binaural processing using the Equalization-Cancellation (EC) mechanism, incorporating processing inaccuracies based on tone-in-noise detection at 500 Hz. Despite this, such inaccuracies are typically assumed to be frequency-independent in binaural speech intelligibility models. This study examines the validity of that assumption and explores how auditory filter bandwidth affects binaural masking release. Experiment I measured tone detection thresholds across frequencies from 250 to 2000 Hz in 12 normal-hearing and 5 hearing-impaired listeners, varying the interaural phase difference (IPD) of noise between 0 and 5π. Results were compared with EC model predictions. Binaural inaccuracies showed a low-pass effect, reducing binaural masking level differences (BMLDs) at higher frequencies. However, the EC model inaccurately predicted BMLDs at 250 Hz. Experiment II involved a subset of listeners performing speech-in-noise intelligibility tasks with low-pass filtered speech. This allowed assessment of whether tone-in-noise detection could predict speech recognition thresholds (SRTs), particularly in hearing-impaired individuals whose low-frequency hearing remained near normal. Findings revealed that adapting the model’s binaural inaccuracies improved SRT predictions beyond audiometric thresholds alone.
Key words: Binaural / Tone-in-noise / Binaural processing inaccuracies / Speech in noise / Hearing impairment
© The Author(s), Published by EDP Sciences, 2026
 This is an Open Access article distributed under the terms of the Creative Commons Attribution License (https://creativecommons.org/licenses/by/4.0), which permits unrestricted use, distribution, and reproduction in any medium, provided the original work is properly cited.
1 Introduction
Several binaural speech intelligibility models have successfully been used to predict the outcome of speech intelligibility experiments in different acoustic scenarios ranging from anechoic conditions to reverberant conditions (e.g. [1–8]). These models can be separated into a front-end, which mimics human auditory processing, and a back-end, which quantifies the usable speech information in the acoustical signal. The front-end usually consists of a band-pass filterbank (e.g. a gammatone filterbank; [9]) to mimic the frequency selectivity of the auditory system and an equalization-cancellation (EC) mechanism [10] to model the effective binaural auditory processing of human listeners. The back-end usually consists of an intrusive model like the Speech Intelligibility Index (SII; [11]), the Speech Transmission Index (STI; [12]), the short-time Objective Intelligibility (STOI; [13]) measure or a non-intrusive model (for an overview see e.g. [14]).
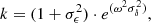
The EC model [10] uses interaural differences in the target signal and the interfering signal to improve the signal-to-noise ratio (SNR) especially at low frequencies. In the EC model, first, the left ear and right ear channels are equalized in level, such that the interaural level difference (ILD) is compensated. In a second step, the interaural time difference (ITD) or the interaural phase difference (IPD) between the left and right ear is equalized such that the SNR at the output of the EC stage, which is calculated by subtracting left and right ear channel from each other, is improved. The EC processing can be used to describe the outcome of experiments with narrow-band target signals like tone-in-noise detection tasks, but also for broad-band signals like speech, where independent EC processing across frequency bands is assumed. In this way, the EC stage can account for the binaural release from masking, which is observed when a target source and an interfering source differ in their ITDs or IPDs, or – more ecologically relevant – if they differ in their spatial location. Binaural processing inaccuracies have been incorporated into the EC model in order to limit the resolution of the equalization process in level and time. Consequently, no perfect cancellation can be achieved if the binaural processing inaccuracies are used and the SNR improvement is limited. The binaural processing inaccuracies have first been derived by Durlach [10], where the ITD inaccuracy was assumed to be a normally-distributed random variable with zero mean and a standard deviation of 105 μs. An analytical formula for calculating the BMLD according to Durlach [10] has been introduced by Culling et al. [15] and is given by:
![Mathematical equation: $$ \begin{aligned} \mathrm{BMLD} = 10\cdot \mathrm{log}_{10}[\frac{k-\mathrm{cos}(\phi _S+\phi _N)}{k-\rho _N}], \end{aligned} $$](/articles/aacus/full_html/2026/01/aacus250180/aacus250180-eq1.gif) (1)
(1)
where ϕS and ϕN are the phases of the target signal and the interfering noise, and ρN is the interaural coherence of the noise. The term k incorporates the frequency dependency of the BMLD and the binaural processing inaccuracies. It is given by
 (2)
(2)
with σϵ = 0.25 and σδ = 0.00105.
These binaural processing inaccuracies have been modified by vom Hövel [16], who fitted the binaural processing inaccuracies to binaural tone-in-noise detection thresholds obtained in an experiment by Langford and Jeffress [17] for jittering the ITD and to binaural tone-in-noise detection thresholds obtained in an experiment by Egan [18] for jittering the ILD. Both measurements were obtained for a single frequency of 500 Hz with normal-hearing listeners. In the experiment by Langford and Jeffress [17] tone detection thresholds were obtained in broadband noise, where the ITD of the noise was varied. In the experiment by Egan [18], the tone detection thresholds were obtained, while the ILD of the noise was varied. The processing inaccuracies derived by vom Hövel [16] are assumed to be normally distributed random variables with zero mean, and – in contrast to Durlach [10] – a standard deviation which is a function of ITD and ILD, respectively. These standard deviations of the processing inaccuracies are given by
![Mathematical equation: $$ \begin{aligned} \sigma _{\delta } = \sigma _{\delta 0} \cdot [1+ \frac{|\mathrm \Delta |}\mathrm{\Delta _{0}}], \end{aligned} $$](/articles/aacus/full_html/2026/01/aacus250180/aacus250180-eq3.gif) (3)
(3)
and
![Mathematical equation: $$ \begin{aligned} \sigma _{\epsilon } = \sigma _{\epsilon 0} \cdot [1+ (\frac{ \alpha }{\alpha _{0}})^p], \end{aligned} $$](/articles/aacus/full_html/2026/01/aacus250180/aacus250180-eq4.gif) (4)
(4)
with σδ0 = 65 μs, Δ0 = 1.6 ms, σϵ0 = 1.5 dB, α0 = 15 dB, and p = 1.6 [16].
These values have for example been used in the binaural speech intelligibility models by Beutelmann et al. [2] and Andersen et al. [5], Hauth and Brand [7], and Hauth et al. [8]. Figure 1 shows the standard deviations of the ITD and ILD inaccuracies as derived by vom Hövel [16]. The standard deviation of the ITD processing inaccuracy is defined in the time domain and assumed to grow linearly with ITD. The standard deviation for an ITD of 0 μs (and thus the intercept) was set to 65 μs. The standard deviation of the ILD processing inaccuracy is assumed to grow exponentially with increasing absolute value of the ILD. In the binaural speech intelligibility models mentioned above, these processing inaccuracies are applied in each frequency band, and therefore, are assumed to be independent of center frequency. However, it is unclear if this assumption is valid, because, to our knowledge, a frequency dependency of the binaural processing inaccuracies by vom Hövel [16] and its behavior for large ITDs has not yet been investigated especially at frequencies lower than 500 Hz and compared to predictions of binaural speech intelligibility models using the EC model.
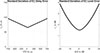 |
Figure 1. Standard deviations of the ITD error σδ and ILD error σϵ in the EC mechanism derived by vom Hövel [16]. The standard deviation of the ITD error is assumed to grow linearly with increasing ITD, while the ILD error in dB grows exponentially with increasing ILD (in dB). |
Binaural unmasking, which relies on ITDs or IPDs, gets worse with increasing frequency (e.g. [19]). The same holds for the ability of the auditory system to preserve the temporal fine structure of a stimulus, which gets also worse with increasing frequency and is often called “phase locking”. The loss of phase locking has been regarded as the main reason for the reduction of BMLDs with increasing frequency [20, 21]. The time domain implementation of the binaural processing inaccuracies in the EC mechanism by Durlach [10] and vom Hövel [16] generally accounts for this finding for the N0Sπ or NπS0 condition (where either the phase of the speech or the noise is interaurally inverted, while the phase of the respective other is not). The constant ITD inaccuracy leads to an increasing IPD inaccuracy with increasing frequency resulting in a decreasing BMLD with increasing frequency. However, this implementation implies that the predicted BMLD at 250 Hz is even higher than at 500 Hz. In the literature, there are different findings for BMLDs at frequencies lower than 500 Hz: In the early work by Hirsh [22], slightly lower BMLDs have been reported for the NπS0 condition at 200 Hz compared to 500 Hz, but higher BMLDs in the N0Sπ condition (see their Fig. 3 or Tab. 1). van de Par and Kohlrausch [19] investigated the effect of masker bandwidth and center frequency on binaural release from masking. Their data indicate that the binaural release from masking gets smaller for frequencies below 500 Hz in the NπS0 condition (see their Fig. 1). Taken together, it is still not clear, whether predicting BMLDs in tone-in-noise detection experiments at different center frequencies might require frequency dependent binaural processing inaccuracies in the EC model especially at low frequencies, if the processing inaccuracies by vom Hövel [16] are used.
Moreover, this study analyzed if the binaural processing inaccuracy can be described as a function of ITD and how predictions with the EC model incorporating these binaural processing inaccuracies change for large ITDs. Physiological measurements in mammals suggest that the binaural neurons respond best to an ITD which is within a half-cycle (π) of the corresponding frequency band [23]. That’s why nearly all binaural models have followed Durlach [24] in restricting the binaural processing stages to use equalization delays within the so called “π-limit”. Both questions were addressed in Experiment I, where the frequency dependency of BMLD curves was investigated in 12 listeners with normal hearing and 5 listeners with high-frequency hearing loss. The results obtained in the listening experiments were compared to BMLD predictions of the EC model.
In Experiment II, binaural speech intelligibility experiments were performed by a subset of the same listeners in order to test the hypothesis, if tone-detection performance is reflected in binaural speech reception thresholds (SRTs), i.e., if better tone detection is related to better SRTs. We expected, that this experiment might reveal differences in binaural unmasking between listeners with normal and with impaired hearing, which could potentially be used to improve SRT predictions for listeners with impaired hearing. In this study, the binaural speech intelligibility model by Beutelmann et al. [2] was used, which considers the individual pure-tone audiogram using a threshold simulating noise. However, it has been shown that the effect of hearing impairment was not fully accounted for by incorporating the audiogram alone as it does not reflect, for instance, supra-threshold deficits [25, 26] and potential individual binaural processing capabilities. In a study conducted by Neher et al. [27] it was shown that listeners with hearing impairment differed in their binaural intelligibility difference (BILD), which is the binaural release from masking by spatially separating the target speech source from the interfering noise source in a speech intelligibility experiment, and BMLDs at 500 Hz even though they were matched in age, hearing loss (according to the pure-tone audiogram), and cognitive factors. This finding suggested that supra-threshold deficits are reflected in binaural tone detection thresholds and should, therefore, also be accounted for in binaural speech intelligibility models.
The SRTs of Experiment II were predicted using BSIM with individual adapted binaural processing inaccuracies, which were derived based on the binaural tone detection thresholds from Experiment I. It was hypothesized that these individually adjusted binaural processing inaccuracies lead to better predictions of the individual SRTs. Both listeners with normal hearing and with hearing impairment performed SRT measurements for low-pass filtered speech with a cut-off frequency of 1500 Hz, in order to exclude effects of high frequency hearing loss and to focus on the frequency region, where binaural unmasking can be assumed to be largest.
2 Methods
2.1 Listeners
12 listeners with normal hearing and 5 listeners with impaired hearing participated in Experiment I. 8 of the 12 normally hearing listeners and the hearing-impaired listeners of Experiment I also participated in Experiment II. Normal hearing was guaranteed by standard pure-tone audiometry at the frequencies 125, 250, 500, 1000, 2000, 3000, 4000, 6000, and 8000 Hz, where none of the thresholds exceeded 20 dB HL. Hearing impaired listeners with nearly normal hearing at frequencies up to 1000 Hz were chosen in order to reduce low-frequency audibility effects on the BMLD measurements. Figure 2 shows the individual audiograms of the listeners with impaired hearing. Up to 1000 Hz, these listeners had audiometric thresholds, which were better than 30 dB HL.
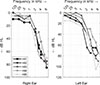 |
Figure 2. Audiograms of the listeners with hearing impairment. The left and right panels show the audiogram of the left and right ear, respectively. |
2.2 Experiment I: binaural tone-in-noise detection
The first experiment was a binaural tone-in-noise detection task, similar to the BMLD measurements by Langford and Jeffress [17]. Binaural tone-in-noise detection thresholds were determined for carrier frequencies of 250, 500, 750, 1000, 1500, and 2000 Hz for listeners with normal hearing and for 500, 750, 1000, and 1500 Hz for the listeners with impaired hearing. Tone detection was investigated in Gaussian white noise, which was bandpass filtered between 100–4000 Hz. The broad-band noise was preferred over narrow band noise because it allows for an easier discrimination between target tone and interfering noise. Moreover, the experiments by Langford and Jeffress [17] and Egan [18] were also performed using broadband noise. A 3-alternative-forced-choice (AFC) 1-up-2-down procedure converging to the 70.7% correct point on the psychometric function was used to determine tone detection thresholds.
2.3 Apparatus
The stimuli were generated using MATLAB (MathWorks, Natick, MA, USA) using the AFC Toolbox (Version 1.4), developed by Stephan Ewert at Carl von Ossietzky Universität, Oldenburg, Germany, and presented binaurally via an RME Fireface UC soundcard (Audio AG, Haimhausen, Germany) and HD 650 headphones (Sennheiser, Wedemark, Germany). The sound output was calibrated to dB SPL using a Brüel&Kjaer (B&K, Nærum, Denmark) 4153 artificial ear, a B&K 4134 half-inch microphone, a B&K 2669 preamplifier, and a B&K 2610 measuring amplifier. The noise level was set to 75 dB SPL and the level of the tone was varied to find the individual threshold. The experiments were conducted in a double-walled, sound-attenuated booth.
2.4 Stimuli
The target tone was always presented diotically (S0), i.e., the same signal was presented to both ears. According to Langford and Jeffress [17], the tested ITDs of the noise were selected to mirror fixed IPDs for each tested frequency ranging from 0 to 5π in steps of π/2 leading to frequency dependent ITDs. For example, ITDs ranging from 0 to 5 ms in steps of 0.5 ms were used at 500 Hz, while the ITDs ranging from 0 ms to 10 ms in steps of 1 ms were used at 250 Hz. This method was chosen, because binaural release from masking is largest using IPD of π in either the tone or the noise. The tone duration was set to 300 ms with 50 ms raised-cosine ramps.
2.5 Experiment II: binaural speech-in-noise experiments
In Experiment II, a binaural speech-in-noise test was conducted with the same listeners as in Experiment I. Speech intelligibility experiments were conducted using the Oldenburg Sentence Test (OlSa, [28–30]) in speech-shaped stationary noise with the same long term average spectrum of the speech. In the remainder of this article, this noise is referred to as “Olnoise”. OlSa sentences consist of five-word-sentences with a fixed grammatical structure noun-verb-numeral-adjective-object, where each word is randomly selected from a list of 10 words. To determine the SRT for 50% correctly understood words, an adaptive procedure was used for controlling the level of the speech (Eq. 9, [31]) and the SRT was estimated using a maximum likelihood fit. Each SRT was determined using a list of 20 sentences, which was randomly selected out of 45 lists. Because the main focus of this study lay on the binaural processing capabilities of the listeners, speech and noise stimuli were modified as follows: Both speech and noise signals were low-pass filtered with a cut off frequency of 1500 Hz in order to minimize the influence of the high frequency hearing loss for the listeners with hearing impairment while keeping their ability for binaurally processing the signals, which is most effective at low frequencies. To be able to compare the results obtained for normal-hearing listeners and hearing-impaired listeners, the listeners with normal hearing were provided with the same stimuli as the hearing-impaired listeners. In total, 4 SRTs were obtained for each listener: (1) monaurals SRT for the left ear, (2) monaural SRTs for the right ear, (3) diotic SRTs, i.e., the same signals are presented to the left and right ear (N0S0), and (4) dichotic SRTs, where the phase of the noise was inverted between both ears (NπS0). This was done in order to be able to compare the outcome of the speech intelligibility tests with the binaural tone-in-noise detection experiment in a frequency region, where the listeners with hearing impairment showed nearly normal hearing thresholds according to the audiogram.
2.6 Model predictions
The binaural speech intelligibility model (BSIM, [2]) consist of two stages: the front-end, that predicts the improvement of the SNR due to binaural unmasking and better ear listening, and the back-end that predicts the speech intelligibility. In the front-end, the EC model is applied in order to predict the improvement of the SNR due to binaural processing. To achieve this, the input signal is filtered into 30 ERB-spaced [32] frequency bands using a gammatone filter bank [9]. The listener’s individual hearing threshold is considered by adding a Threshold Simulating Noise (TSN) to each ear. This TSN is calculated by adding the frequency specific dB HL values to the threshold of normal hearing listener in dB SPL as defined in EN-ISO389-7 [33], where the threshold is determined binaurally in the free-field and is referred to as Minimum Audible Field (MAF). The TSN is uncorrelated between the ears, so that the EC model cannot cancel it. Afterwards, EC processing is applied in each frequency channel to improve the SNR. Finally, the resulting SNR is compared to the monaural SNRs at the left and right ear channel and the maximum of all three alternatives is considered as the result of the first stage.
The model’s back-end uses the output of the front-end and estimates the speech intelligibility using the Speech Intelligibility Index (SII, [11]). The SII is calculated essentially as a weighted sum of the band-specific SNRs. Before the summation, the band-specific SNRs are limited to a range from −15 dB and 15 dB. The weighting is given by a band importance function, which mimics the importance of the individual frequency bands for human speech recognition, resulting in an SII value between 0 and 1. In this study, the NNS (various nonsense syllable tests where most of the English phonems occur equally often) weighting function [11] was used. The resulting SII values can then be mapped to intelligibility values. In this study, only SRT values are analyzed. Therefore, only the reference SII at the SRT is required, which we set to an SII value of 0.2. This values matches the SRT of −7.1 dB of listeners with normal-hearing for OlSa sentences in broadband speech shaped noise [30]. The front-end of the model without using the back-end was applied to the signals of Experiment I in order to evaluate how closely the tone-in-noise threshold of the model can be predicted by BSIMs front-end. This was done in two ways: Firstly, using the frequency independent processing errors derived for 500 Hz by vom Hövel [16] in the EC processing, in order to test the hypothesis of frequency independent binaural processing inaccuracies. And secondly, using optimized frequency dependent binaural processing accuracies, in order to test the hypothesis, that this can improve the prediction accuracy.
The complete BSIM consisting of front-end and back-end is then applied to the results of Experiment II. Again, this was done using the original frequency independent binaural processing inaccuracies and the frequency dependent processing accuracies derived based on the results of Experiment I. The underlying hypothesis of this approach is that the same enhancement mechanism is used by the human auditory system for narrow-band target signals as in tone-in-noise detection tasks and for broad-band target signals as in speech-in-noise tasks.
3 Results
3.1 Experiment I: binaural tone-in-noise measurements
Figure 3 shows the BMLDs obtained in the binaural tone-in-noise detection task for the 12 listeners with normal hearing and the BMLDs predicted by the EC model. The BMLD denotes the relative improvement of the tone detection threshold in the dichotic condition relative to the diotic condition. The BMLD is high if the ITD of the noise results in a phase shift corresponding to odd (1, 3, 5) multiples of π at the tested frequency, and low if the ITD corresponds to phase shifts of even (2, 4) multiples of π. This results in a periodic pattern of the BMLD, which can be observed in Figure 3 and is referred to as “Jeffress curves”. The largest BMLD of approximately 11 dB can be observed at 500 Hz for an ITD of the noise of 1 ms, corresponding to a phase shift of π, which is in line with results from the literature (e.g. [17]). With increasing frequency, the maximum achievable BMLD is reduced by approximately 4 dB at 1000 Hz and by 6 dB at 2000 Hz. This finding is in line with literature (e.g. [19]), where a correlation between the binaural release from masking and the capability of phase locking on the auditory nerve was observed. Interestingly, the BMLD observed for an IPD of  , which corresponds to an ITD of 750 μs at 500 Hz, is always as good as for an IPD of π for all tested frequencies. For the tested frequency of 250 Hz (top-left panel of Fig. 3), the BMLD is reduced compared to the 500 Hz condition: For an IPD of the noise of π, the BMLD at 250 Hz is 8 dB, which is 3 dB lower than the BMLD obtained at 500 Hz. The reason for this is two-fold: Firstly, the diotic threshold is lower at 250 Hz than at 500 Hz, because the auditory filter can be assumed to be narrower at 250 Hz than at 500 Hz. According to the definition of the equivalent rectangular bandwidth (ERB = 24.7 ⋅ (4.37 ⋅ f[kHz]+1) [32]), the reduction of masking by using the filter at 250 Hz and the same broad band noise can be up to 1.8 dB. This can also be found in the data, where the median diotic threshold at 250 Hz is reduced by 1.25 dB compared to the diotic threshold at 500 Hz, which is slightly lower than the theoretical value according to the ERB formula described above (see Fig. 4).
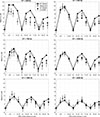 |
Figure 3. Binaural Masking Level Differences (BMLD) measured in 12 listeners with normal hearing (gray diamonds). The tested frequencies of the tone were 250, 500, 750, 1000, 1500, and 2000 Hz. The IPD of the noise was varied from 0 to 5π in steps of 0.5π, leading to a frequency dependent ITD. For example, an IPD of π corresponds to an ITD of the noise of 1 ms at 500 Hz and to 0.5 ms at 1000 Hz. Additionally, the IPD of |

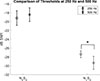 |
Figure 4. Diotic (N0S0) and dichotic (NπS0) tone detection thresholds obtained at 250 Hz (open circles) and 500 Hz (open diamonds). |
Secondly, the dichotic thresholds are statistically significantly increased by approximately 2 dB in the 250 Hz condition compared to the 500 Hz condition (t-test, p = 0.021). In addition to the effect of center frequency on BMLD, an effect of the tested IPD can be observed: With increasing IPD of the noise, the maximum achievable BMLD decreases from π to 3π and from 3π to 5π almost independently of center frequency. Figure 5 shows the differences between BMLDs (ΔBMLD) between π and 3π (left panel) and between 3π and 5π (right panel). Note, that the ΔBMLDs are identical to the differences between the dichotic tone detection thresholds, as the diotic thresholds are compensated due to the difference calculation. The largest difference in dichotic tone detection thresholds can be observed at 250 Hz, where the median difference is −4.8 dB. At 500 Hz, a difference of −4 dB is observed, which is reduced to −2.5 dB at 750 Hz, to −2 dB at 1500 Hz, and to 0.8 dB at 2000 Hz. A Bonferroni corrected pair-wise comparison revealed a statistical difference in the BMLD differences between 250 Hz and 750 Hz as well as between 250 Hz and 2000 Hz. Moreover, the difference observed at 500 Hz was statistically significant different from the difference observed at 2000 Hz. No statistical difference was observed in the tone detection threshold differences between an IPD of 3π and 5π at the tested frequencies. The differences are in the range from −2.8 to −3 dB independent of frequency, except for 250 Hz and 150 Hz, where the difference is below −2 dB.
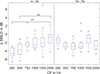 |
Figure 5. Difference between BMLDs (ΔBMLD) for an IPD of π and an IPD of 3π (left panel) and for an IPD of 3π and an IPD of 5π (right panel). A negative ΔBMLD indicates that the tone detection threshold obtained at an IPD of π is lower (better) than at the tone detection threshold obtained at an IPD of 3π. |
3.2 EC-model predictions: effects of phase shift and frequency
Consistent to the model by Durlach [24], the EC stage with processing inaccuracies derived by vom Hövel [16] is able to predict the decreasing BMLD with increasing frequency (connected black dots of Fig. 3). This is a consequence of the model’s processing inaccuracy, which is defined in the time domain and thus, its effect increases with increasing frequency, where an IPD of π corresponds to an ITD which is decreased by a factor of 2 per frequency increase of one octave. However, for 250 Hz, the predicted BMLD for the delay corresponding to a phase shift of π is with about 16 dB much larger than the measured BMLD with about 9 dB. Similar differences were also found for an ITD of 6 ms (3π). While the measured BMLDs for 250 Hz tend to be smaller compared to the 500 Hz condition, the predicted BMLD is larger.
Moreover, it can be seen, that even though the BMLD is generally well predicted for the first cycle (from 0:2π), the prediction gets worse for larger ITDs of the noise. The BMLDs are overpredicted even though the binaural processing inaccuracy of the model increases with increasing ITD.
The effect of reduced BMLDs for an IPD of 3π or 5π relative to π is conserved because a side maximum (and not the main peak) of the cross-correlation function is used for estimating the ITD. Therefore, the cancellation is not as effective as it is for an IPD of π. The linearly growing errors introduced by vom Hövel [16] basically mirror the effect of the π-limit. Both are incorporated in the BSIM model and do not affect the relative differences of the predicted BMLD for odd multiples of π.
3.3 EC-model predictions: use of wider auditory filters
As mentioned above, the π-limit depends on the width of the auditory filters. We evaluated if BMLD predictions change when the EC model is used with effectively wider binaural auditory filters. This is motivated by Beutelmann et al. [34] who showed that wider (binaural) peripheral filters better explain SRTs in noise, when the IPD of the noise differed in adjacent frequency bands. This does not mean that the human auditory filters per se are wider just because binaural processing is involved. These “wider” binaural filters might just indicate that across frequency processing (using two different auditory filters across ears) takes place in binaural processing, which can be modeled in a simplified way by increasing the bandwidths of the monaural auditory filters. Beutelmann et al. [34] found that increasing the bandwidth of the auditory filters by a factor of 2.3 led to the maximum congruency between predicted and observed SRTs.
In order to test the hypothesis that across frequency processing affects the BMLD in tone in noise experiments especially for ITDs, which are larger than the frequency specific π-limit, we used the same binaural bandwidth (2.3 ERB) for the EC model. As hypothesized, this approach improved the prediction accuracy for ITDs, which are larger than the corresponding periods of the gammatone filters, especially for frequencies below 1000 Hz. The results are shown by the black triangles in Figure 3. The predictions of the first BMLD cycle (from 0 to 2π) are only little affected by the wider binaural filters.
3.4 Listeners with hearing loss
A subset of the tone in noise experiments for the frequencies 500, 750, 1000, and 1500 Hz was also performed by 5 listeners with high frequency hearing loss. Figure 6 shows the individual BMLDs for the listeners with hearing impairment. The results show a large variability across listeners. HI1 (black squares) performs best at 500 Hz (even better than most of the normal hearing listeners and as good as the EC model), while HI1 performs worst at 1500 Hz. This indicates that binaural unmasking in these hearing-impaired listeners can be reduced on a very individual level even though the hearing loss in these listeners at the test frequencies would be typically regarded as close to negligible. In the following we evaluate, if reduced BMLDs in tone-in-noise experiments was related to a reduced binaural unmasking in speech-in-noise experiments and how this can be included in the model.
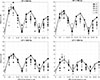 |
Figure 6. Individual BMLDs for the hearing-impaired listeners in comparison with the normal hearing data and model data. |
3.5 Experiment II: binaural speech in noise experiments
Figure 7 shows the SRTs, where both speech and noise were low-pass filtered with a cut-off frequency of 1500 Hz. Boxplots indicate the SRTs of 8 normally hearing listeners, the individual SRTs of the listeners with impaired hearing are shown as squares in the same way as in Experiment I. SRTs were obtained for the left and right ear, separately. Additionally, the diotic SRTs and the dichotic SRTs, where the phase of the noise was interaurally inverted, were measured.
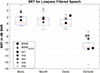 |
Figure 7. SRTs of the normal-hearing listeners (box plots) and hearing-impaired listeners (individual datapoints). The listening conditions are: monaurally left ear (“MonL”), monaurally right ear (“MonR”), diotic, and dichotic with interaurally phase-inverted noise. Model predictions (black bullets) are only shown for the diotic and dichotic condition. The BSIM prediction with ITD processing inaccuracy matched to the average of listeners HI2, HI3, HI4, and HI5 is shown as diamond. HI1 can be considered as binaurally normally hearing. |
In the monaural conditions and in the diotic condition, the median SRTs for the normal-hearing listeners are observed at −3 to −4 dB. In the dichotic condition, SRTs are reduced by 7 dB, such that a median SRT of −11 dB is obtained. One listener even achieved an SRT of −17 dB. Based on the individual results observed in the tone-in-noise detection task, the individual binaural processing inaccuracy was derived for each listener with hearing impairment. The individual BMLD obtained at 500 Hz and a time delay of the noise corresponding to an interaural phase shift of π was chosen as a reference for fitting the binaural processing inaccuracy of the EC mechanism. This binaural processing inaccuracy was derived by changing it adaptively until the difference between measured BMLD and predicted BMLD was smaller than 0.25 dB. The individual values for each hearing-impaired listener are shown in Table 1. Note, that BSIM already considers the listener’s individual hearing loss using a threshold-simulating noise. In these simulations we evaluate, if the additional consideration of a reduced binaural processing accuracy can improve BSIMs prediction accuracy. Note that assessment of the individual binaural processing inaccuracies from Experiment I was rather roughly estimated and that the resulting differences in predicted SRTs between HI2, HI3, HI4, and HI5 were rather small. Consequently, we present the model prediction for only one average value of the standard deviation of the processing inaccuracy of 100 μs. For listener HI3, the assumed standard deviation of 65 μs for normally hearing listeners was used, as HI1 can be considered as normally hearing listener in both, the tone-in-noise and the speech-in-noise experiment. The other listeners with impaired hearing, however, show worse performance in both, the tone-in-noise and in the speech-in-noise experiment. Furthermore, these hearing-impaired listeners show worse monaural and diotic SRTs as well.
BSIM slightly overestimates the SRT in the diotic condition, but matches the median SRT in the dichotic condition. By increasing the model’s internal standard deviation of ITD inaccuracy from 65 μs to 100 μs, the predicted dichotic SRT is increased by approximately 3 dB and shows better agreement with the listeners with hearing impairment except for HI1, who performs like the listeners with normal hearing.
4 General discussion
4.1 Frequency dependency of binaural processing inaccuracy
Binaural tone-in-noise detection experiments were performed to investigate the frequency dependency of BMLDs. The BMLDs obtained with 12 listeners with normal hearing were compared to predictions using an EC model, where binaural processing inaccuracies were considered. So far, these inaccuracies were solely determined for 500 Hz and assumed to jitter temporal information rather than phase information. It has been shown that the inaccuracy investigated for 500 Hz, which has originally been applied by vom Hövel [16] to the EC model, can be used to predict BMLDs also for higher frequencies. Because the binaural processing inaccuracy is defined to have a constant standard deviation in microseconds, the detrimental effect becomes more prominent with increasing frequency as the cancellation requires an equalized phase.
The finding, that the binaural unmasking becomes less effective with increasing frequency can be explained by the fact that an accurate coding of the temporal fine structure is required by the binaural system to achieve a high BMLD. The loss of phase locking with increasing frequency is assumed to limit the performance in the dichotic conditions of binaural tone-in-noise experiments (e.g. Bernstein and Trahiotis [20]). The same trend is captured by the EC model, even though phase locking is not explicitly accounted for in the model. However, the processing inaccuracies are implemented in the time domain. With increasing frequency, the effect of the inaccuracy gets larger as the same phase relation between both ears is achieved at a much smaller delay. Therefore, the impact of the delay inaccuracy gets larger with increasing frequency, leading to a less accurate equalization in time and, consequently, to a less effective cancellation of the interfering source or noise. At 250 Hz, a larger deviation between the perceptual data and the predicted BMLD was observed. In the dichotic condition, the thresholds for 250 Hz are only slightly worse than in the 500 Hz condition. However, the EC mechanism predicts the thresholds to be even better than at 500 Hz. Therefore, the standard deviation of the processing inaccuracy needs to be increased to 130 μs at 250 Hz, while it can remain to be 65 μs at frequencies of 500 Hz and above. The reduced BMLD at 250 Hz in the NπS0 is consistent with the findings by Hirsh [22] and van de Par and Kohlrausch [19]. However, the increased processing inaccuracy does not agree with the findings in the N0Sπ condition by Hirsh [22], where larger BMLD of approx. 14 dB was observed at 200 Hz compared to approx. 10 dB at 500 Hz. Instead, the predicted BMLD would remain at approx. 15 dB for the 500 Hz tone and the 250 Hz tone if the increased standard deviation of 130 μs is used at 250 Hz. In the dissertation by Zerbs [35], where a binaural model for tone detection experiments was developed, the model predicted the BMLD to be larger at 250 Hz in the N0Sπ condition, the measurements however showed the same BMLD of approx. 15 dB in both the 250 Hz and the 500 Hz condition. In the NπS0 condition, the BMLD was shown to be smaller at 250 Hz than at 500 Hz in Zerbs [35]. The differences in BMLDs at lower frequencies observed by Hirsh [22] and later studies might be caused by the different methods used to obtain the thresholds. While Hirsh [22] used a method of adjustment and a duration of 1 s for the tone with expert listeners, later studies used a 3 AFC task with shorter durations of 300 ms. Moreover, in our study, the thresholds were not obtained with expert listeners.
The periodic pattern with increasing ITD, which can be observed at 500 Hz and higher frequencies, is less prominent at 250 Hz. This might be caused by the relatively large ITDs of more than 5 ms, which are much larger than any ITD the auditory system usually has to deal with and therefore might be too large to be used by the human binaural system.
4.2 Increased filter bandwidth of the EC model
The same data was modeled using the EC model according to Beutelmann et al. [34] with 2.3 ERB wide filters instead of 1 ERB wide filters like in Beutelmann et al. [2]. The 2.3 ERB wide filters better described the perceptual data than the 1 ERB wide filters. This indicates that the 2.3 ERB wide filters not only explain the binaural unmasking of broadband speech signals better (as concluded in [34]) but also of the narrow band signal used here. However, changing the effective binaural bandwidth only influences BMLDs for ITDs which correspond to IPDs larger than 2π. This can be explained by the fact that by increasing the bandwidth of the auditory filters, the correlation of the secondary maxima between left and right ear is reduced leading to a reduction of predicted BMLDs.
In Culling [36], a combination of broader binaural filters and delay dependent binaural processing inaccuracies lead to the best predictions of BMLDs over a range of different center frequencies. This overlaps with our findings as a combination of delay dependent binaural processing inaccuracies and broader binaural filters yielded the best results, especially for large delays. Besides these two factors, taking the π−limit in the estimation process of the ITD into account is crucial for predicting the periodic pattern of BMLDs for multiples of π. In our case, however, it is necessary to include a larger processing inaccuracy at lower frequencies, which has not been used by Culling [36]. The reason for this the different observations made in the underlying data set, which might be caused by the different methods used to obtain the thresholds.
4.3 Individualization of processing inaccuracies for listeners with impaired hearing
The listeners with impaired hearing showed a large variance of BMLDs. Four of five listeners had a reduced BMLD, and one listener showed BMLDs at 500 Hz, which were as good as the BMLDs for listeners with normal hearing. However, these findings were not consistent across frequencies.
In the binaural speech intelligibility experiment, those listeners with impaired hearing, who showed a reduced BMLD in the tone detection task at 500 Hz, also showed reduced binaural release from masking for speech. The hearing-impaired listener with normal-hearing BMLDs showed a normal-hearing binaural release from masking for speech. Similar observations were made in a study by Neher et al. [27], where a negative association between BILD and SRTs was observed (higher BILDs were associated to lower SRTs). Interestingly, in their experiment it was also shown, that listeners with higher BILDs benefited more from low-frequency binaural cues in spatial speech intelligibility experiments than from low frequency SNR improvement provided by the tested algorithm, while listeners with low BILDs showed more benefit from low-frequency SNR improvement than from a preservation of binaural cues.
In order to evaluate whether the predictions of BSIM can be improved by taking these differences between listeners better into account, the processing inaccuracy in the EC stage of BSIM was adapted in order to fit the BMLD at 500 Hz: Four listeners with impaired hearing where considered with virtually the same ITD inaccuracy of 100 μs while one listener with impaired hearing was considered with the normal-hearing standard deviation of 65 μs. This led to an increase of predicted SRTs in the dichotic condition and on average better agreement with measured SRTs for the hearing-impaired listeners. This indicates that binaural tone-in-noise detection data might be used to adapt the binaural inaccuracy in the EC model in order to improve individual speech intelligibility predictions. This has to be evaluated with more listeners in an experiment where the tone-in-noise BMLD is measured at 500 Hz in order to predict the BMLD for speech. However, the individualized prediction of the BMLD for speech failed for the listeners with normal hearing because the variation observed in the tone detection thresholds was much smaller than the variation in the binaural SRTs. This might be due to the low-pass filtered speech stimuli, which were used to increase the effect size in the SRT measurements, as this might have caused the problem that the normally hearing listeners did not reach optimal performance as they were not used to low-pass filtered speech, even though some training was provided.
Given these observations, we, so far, hesitate to recommend using binaural 500 Hz tone-in-noise detection tasks to individualize BSIM’s predictions of SRT data. Before such a recommendation might be justified, much more data of listeners with normal and with impaired hearing is required for both tone-in-noise detection and BMLDs for speech. This is far beyond the scope of this study, which had a too extensive measurement scope per listener for a large sample of listeners with hearing impairment. For that reason, we encourage to measure tone-in-noise detection in studies about binaural speech recognition, so that future studies can answer this question.
5 Conclusions
-
In this study it was shown that the processing inaccuracy in EC processing suggested by vom Hövel [16], which has so far only been evaluated for binaural tone-in-noise detection at 500 Hz, also holds for higher frequencies. This also holds for the processing inaccuracies by Durlach [24] and is a consequence of the realization of the errors in the time domain as they implicitly mirror the loss of phase locking in the auditory system with increasing frequency.
-
For lower frequencies (we tested 250 Hz), the processing inaccuracy of the EC stage needs to be increased to approximately 130 μs in order to account for dichotic tone-in-noise detection thresholds at 250 Hz leading to a bandpass characteristic of the EC processing inaccuracies rather than a low pass characteristic.
-
Broader binaural filters (2.3 ERB) better describe measured BMLDs for large ITDs/IPDs of the noise, indicating that across frequency processing plays a role in binaural unmasking, which has also been observed by Culling [36].
-
Furthermore, it was shown for a small ensemble of listeners with hearing impairment that binaural tone-in-noise detection thresholds at 500 Hz can be used to derive estimate an increased binaural processing inaccuracies, which improved the prediction accuracy of the EC-model even for other frequencies and which can help to improve individual binaural speech intelligibility predictions of BSIM.
Acknowledgments
We thank Sanja Rennebeck, who conducted the measurements for this study. We thank John Culling for his constructive feedback while serving as a reviewer disclosing his identity.
Funding
This work was funded by the Cluster of Excellence “Hearing4all.connects”, by the Deutsche Forschungsgemeinschaft (DFG, German Research Foundation) – Project number 352015383 – SFB 1330 A1 and the project “Individulaisierte, modellbasierte Hörgeräteanpassung (IMFIT)” funded by the European Union and the participation of the state of Lower Saxony.
Conflict of interest
The authors declare no conflict of interest.
Data availability statement
Data are available on request from the authors.
Ethics approval
The methods were approved by the ethics committee of the University of Oldenburg (protocol Drs.-Nr. 04/2018).
Informed consent
All participants received hourly compensation and gave informed consent for their participation in the experiments.
References
- M. Lavandier, J.F. Culling: Prediction of binaural speech intelligibility against noise in rooms. Journal of the Acoustical Society of America 127, 1 (2010) 387–399. ISSN 0001-4966. [CrossRef] [PubMed] [Google Scholar]
- R. Beutelmann, T. Brand, B. Kollmeier: Revision, extension, and evaluation of a binaural speech intelligibility model. Journal of the Acoustical Society of America 127, 4 (2010) 2479–2497. ISSN 0001-4966. [CrossRef] [PubMed] [Google Scholar]
- R. Wan, N.I. Durlach, H.S. Colburn: Application of an extended equalization-cancellation model to speech intelligibility with spatially distributed maskers. Journal of the Acoustical Society of America 128, 6 (2010) 3678–3690. ISSN 0001-4966. [Google Scholar]
- S. Jelfs, M. Lavandier, J.F. Culling: Revision and validation of a binaural model for speech intelligibility in noise. Hearing Research 275 (2011) 96–104. [Google Scholar]
- A.H. Andersen, J.M. de Haan, Z.-H. Tan, J. Jensen: A method for predicting the intelligibility of noisy and non-linearly enhanced binaural speech, in: 2016 IEEE International Conference on Acoustics, Speech and Signal Processing (ICASSP). IEEE, Shanghai, 2016, pp. 4995–4999. ISBN 978-1-4799-9988-0. [Google Scholar]
- A. Chabot-Leclerc, E.N. MacDonald, T. Dau: Predicting binaural speech intelligibility using the signal-to-noise ratio in the envelope power spectrum domain. Journal of the Acoustical Society of America 140, 1 (2016) 192–205. ISSN 0001-4966. [Google Scholar]
- C.F. Hauth, T. Brand: Modeling sluggishness in binaural unmasking of speech for maskers with time-varying interaural phase differences. Trends in Hearing 22 (2018) 2331216517753547. [Google Scholar]
- C.F. Hauth, S.C. Berning, B. Kollmeier, T. Brand: Modeling binaural unmasking of speech using a blind binaural processing stage. Trends in Hearing 24 (2020) 233121652097563. ISSN 2331-2165, 2331-2165. [Google Scholar]
- V. Hohmann: Frequency analysis and synthesis using a gammatone filterbank. Acta Acustica United with Acustica 88, 3 (2002) 433–442. [Google Scholar]
- N.I. Durlach: Equalization and cancellation theory of binaural masking-level differences. Journal of the Acoustical Society of America 35, 8 (1963) 1206–1218. ISSN 0001-4966. [CrossRef] [Google Scholar]
- ANSI S3.5-1997: Methods for Calculation of the Speech Intelligibility Index, 1997. [Google Scholar]
- H.J.M. Steeneken, T. Houtgast: A physical method for measuring speech-transmission quality. Journal of the Acoustical Society of America 67, 1 (1980) 318–326. ISSN 0001-4966. [CrossRef] [PubMed] [Google Scholar]
- C.H. Taal, R.C. Hendriks, R. Heusdens, J. Jensen: An algorithm for intelligibility prediction of time–frequency weighted noisy speech. IEEE Transactions on Audio, Speech, and Language Processing 19, 7 (2011) 2125–2136. ISSN 1558-7916, 1558-7924. [Google Scholar]
- Y. Feng, F. Chen: Nonintrusive objective measurement of speech intelligibility: a review of methodology. Biomedical Signal Processing and Control 71 (2022) 103204. ISSN 17468094. [Google Scholar]
- J.F. Culling, M.L. Hawley, R.Y. Litovsky: Erratum: the role of head-induced interaural time and level differences in the speech reception threshold for multiple interfering sound sources. Journal of the Acoustical Society of America 118, 1 (2005) 552–552. ISSN 0001-4966. [Google Scholar]
- H. vom Hövel: Zur Bedeutung der Übertragungseigenschaften des Aussenohrs sowie des Binauralen Hörsystems bei Gestörter Sprachübertragung (On the importance of the transmission properties of the outer ear and the binaural auditory system in disturbed speech transmission). Ph.D. Dissertation, RWTH Aachen, 1984. [Google Scholar]
- T.L. Langford, L.A. Jeffress: Effect of noise crosscorrelation on binaural signal detection. Journal of the Acoustical Society of America 36, 8 (1964) 1455–1458. [Google Scholar]
- J.P. Egan: Masking-level differences as a function of interaural disparities in intensity of signal and of noise. Journal of the Acoustical Society of America 36, 10 (1964) 1992–1992. ISSN 0001-4966. [Google Scholar]
- S. van de Par, A. Kohlrausch: Dependence of binaural masking level differences on center frequency, masker bandwidth, and interaural parameters. Journal of the Acoustical Society of America 106, 4 (1999) 1940–1947. ISSN 0001-4966. [CrossRef] [PubMed] [Google Scholar]
- L.R. Bernstein, C. Trahiotis: The normalized correlation: accounting for binaural detection across center frequency. Journal of the Acoustical Society of America 100, 6 (1996) 3774–3784. ISSN 0001-4966. [Google Scholar]
- P.M. Zurek, N.I. Durlach: Masker-bandwidth dependence in homophasic and antiphasic tone detection. Journal of the Acoustical Society of America 81, 2 (1987) 459–464. ISSN 0001-4966. [Google Scholar]
- I.J. Hirsh: The influence of interaural phase on interaural summation and inhibition. Journal of the Acoustical Society of America 20, 4 (1948) 536–544. ISSN 0001-4966. [CrossRef] [Google Scholar]
- D. Mcalpine, S. Thompson, K. Von Kriegstein, T. Marquardt, T. Griffiths, A. Deane-Pratt: A π-limit for coding ITDs: neural responses and the binaural display, in: B. Kollmeier, G. Klump, V. Hohmann, U. Langemann, M. Mauermann, S. Uppenkamp, J. Verhey, Eds. Hearing – From Sensory Processing to Perception. Springer, Berlin, Heidelberg, 2007, pp. 399–406. ISBN 978-3-540-73009-5. [Google Scholar]
- N.I. Durlach: Binaural signal detection: equalization and cancellation theory, in: J.V. Tobias, Ed. Foundations of Modern Auditory Theory. Vol. 2. Academic Press, New York, 1972, pp. 369–462. [Google Scholar]
- L.H. Carney: Supra-threshold hearing and fluctuation profiles: implications for sensorineural and hidden hearing loss. Journal of the Association for Research in Otolaryngology 19, 4 (2018) 331–352. ISSN 1525-3961, 1438-7573. [Google Scholar]
- D. Hülsmeier, B. Kollmeier: How much individualization is required to predict the individual effect of suprathreshold processing deficits? Assessing Plomp’s distortion component with psychoacoustic detection thresholds and FADE. Hearing Research 426 (2022) 108609. ISSN 0378-5955. [Google Scholar]
- T. Neher, K.C. Wagener, M. Latzel: Speech reception with different bilateral directional processing schemes: influence of binaural hearing, audiometric asymmetry, and acoustic scenario. Hearing Research 353 (2017) 36–48. ISSN 03785955. [Google Scholar]
- K.C. Wagener, V. Kühnel, B. Kollmeier: Entwicklung und Evaluation eines Satztests für die Deutsche Sprache I: Design des Oldenburger Satztests [Development and evaluation of a sentence test for the German language I: design of the Oldenburg sentence test]. Zeitschrift für Audiologie 38, 1 (1999) 4–15. [Google Scholar]
- K.C. Wagener, T. Brand, B. Kollmeier: Entwicklung und Evaluation eines Satztests für die Deutsche Sprache Teil II: Optimierung des Oldenburger Satztests [Development and evaluation of a sentence test for the German language II: optimization of the Oldenburg sentence test]. Zeitschrift für Audiologie 38, 2 (1999) 44–56. [Google Scholar]
- K.C. Wagener, T. Brand, B. Kollmeier: Entwicklung und Evaluation eines Satztests für die Deutsche Sprache Teil III: Evaluation des Oldenburger Satztests [Development and evaluation of a sentence test for the German language III: evaluation of the Oldenburg sentence test]. Zeitschrift für Audiologie 38, 3 (1999) 86–95. [Google Scholar]
- T. Brand, B. Kollmeier: Efficient adaptive procedures for threshold and concurrent slope estimates for psychophysics and speech intelligibility tests. Journal of the Acoustical Society of America 111, 6 (2002) 2801–2810. ISSN 0001-4966. [Google Scholar]
- B.C.J. Moore, B.R. Glasberg: Suggested formulae for calculating auditory-filter bandwidths and excitation patterns. Journal of the Acoustical Society of America 74, 3 (1983) 750–753. ISSN 0001-4966. [Google Scholar]
- International Organization for Standardization: Acoustics – Reference Zero for the Calibration of Audiometric Equipment – Part 7: Reference Threshold of Hearing Under Free-Field and Diffuse-Field Listening Conditions. ISO 389-7:2019, 2019. EN ISO 389-7:2019, Edition 3. [Google Scholar]
- R. Beutelmann, T. Brand, B. Kollmeier: Prediction of binaural speech intelligibility with frequency-dependent interaural phase differences. Journal of the Acoustical Society of America 126, 3 (2009) 1359–1368. ISSN 0001-4966. [Google Scholar]
- C. Zerbs: Modelling the effective binaural signal processing in the auditory systems. Dissertation, Universität of Oldenburg, 2000. URL http://medi.uni-oldenburg.de/download/docs/diss/zerbs_diss_2000.pdf. [Google Scholar]
- J. Culling: Equalization-cancellation revisited, in: Forum Acusticum 2020, Lyon, France, 2020, pp. 1913–1917. [Google Scholar]
Cite this article as: Hauth C.F. & Brand T. 2026. Adapting the EC model to the frequency dependency of binaural masking level differences — Is this relevant for speech in noise?. Acta Acustica, 10, 38. https://doi.org/10.1051/aacus/2026038.
All Tables
All Figures
|
Figure 1. Standard deviations of the ITD error σδ and ILD error σϵ in the EC mechanism derived by vom Hövel [16]. The standard deviation of the ITD error is assumed to grow linearly with increasing ITD, while the ILD error in dB grows exponentially with increasing ILD (in dB). |
| In the text | |
|
Figure 2. Audiograms of the listeners with hearing impairment. The left and right panels show the audiogram of the left and right ear, respectively. |
| In the text | |
|
Figure 3. Binaural Masking Level Differences (BMLD) measured in 12 listeners with normal hearing (gray diamonds). The tested frequencies of the tone were 250, 500, 750, 1000, 1500, and 2000 Hz. The IPD of the noise was varied from 0 to 5π in steps of 0.5π, leading to a frequency dependent ITD. For example, an IPD of π corresponds to an ITD of the noise of 1 ms at 500 Hz and to 0.5 ms at 1000 Hz. Additionally, the IPD of |
| In the text | |
|
Figure 4. Diotic (N0S0) and dichotic (NπS0) tone detection thresholds obtained at 250 Hz (open circles) and 500 Hz (open diamonds). |
| In the text | |
|
Figure 5. Difference between BMLDs (ΔBMLD) for an IPD of π and an IPD of 3π (left panel) and for an IPD of 3π and an IPD of 5π (right panel). A negative ΔBMLD indicates that the tone detection threshold obtained at an IPD of π is lower (better) than at the tone detection threshold obtained at an IPD of 3π. |
| In the text | |
|
Figure 6. Individual BMLDs for the hearing-impaired listeners in comparison with the normal hearing data and model data. |
| In the text | |
|
Figure 7. SRTs of the normal-hearing listeners (box plots) and hearing-impaired listeners (individual datapoints). The listening conditions are: monaurally left ear (“MonL”), monaurally right ear (“MonR”), diotic, and dichotic with interaurally phase-inverted noise. Model predictions (black bullets) are only shown for the diotic and dichotic condition. The BSIM prediction with ITD processing inaccuracy matched to the average of listeners HI2, HI3, HI4, and HI5 is shown as diamond. HI1 can be considered as binaurally normally hearing. |
| In the text | |
Current usage metrics show cumulative count of Article Views (full-text article views including HTML views, PDF and ePub downloads, according to the available data) and Abstracts Views on Vision4Press platform.
Data correspond to usage on the plateform after 2015. The current usage metrics is available 48-96 hours after online publication and is updated daily on week days.
Initial download of the metrics may take a while.