Figure 11.
Download original image
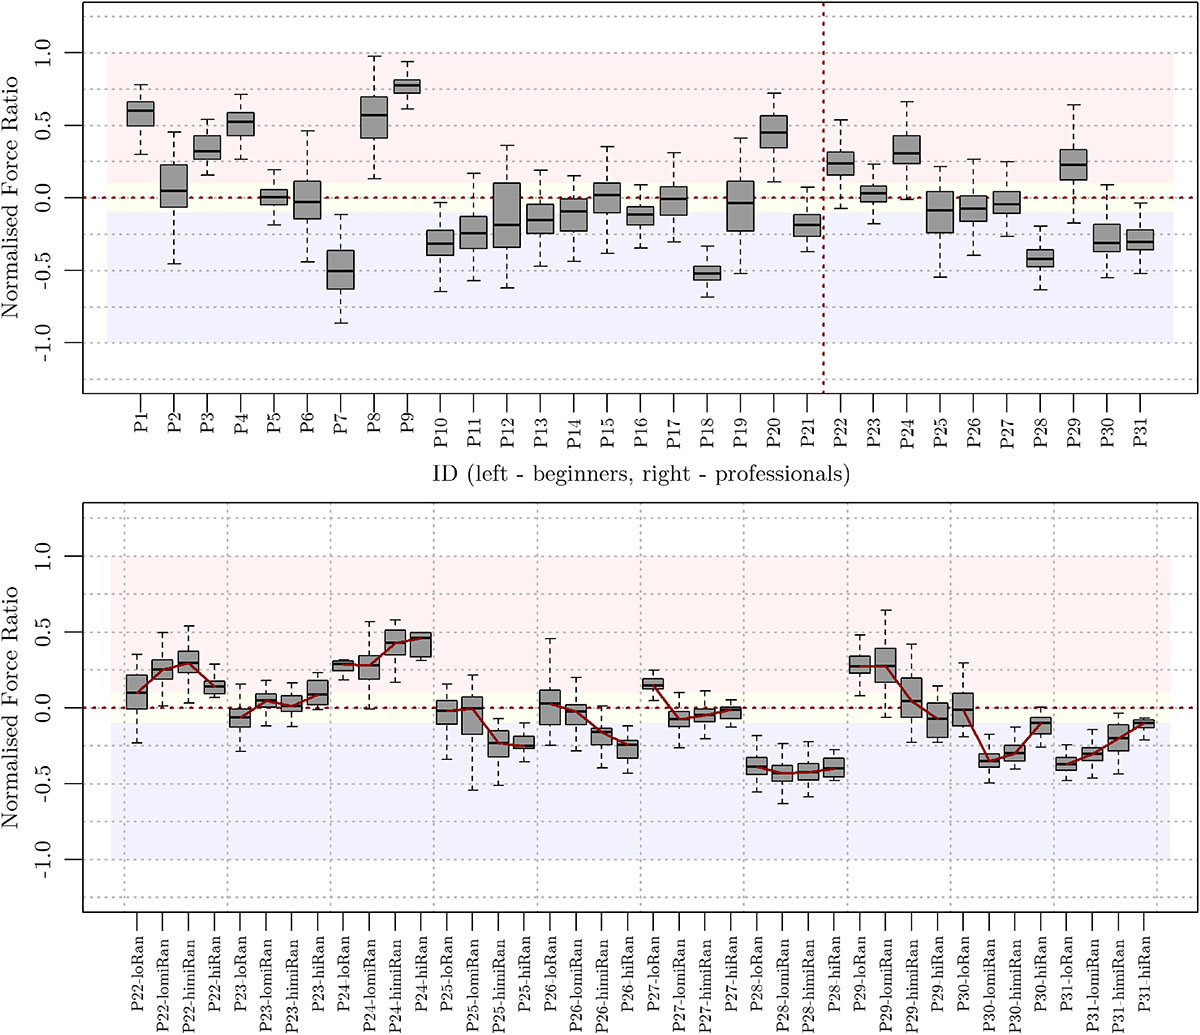
Box plots of the normalised force ratio between upper and lower lips. The top panel shows data across all notes for all participants; the bottom panel focuses on participants P22 to P31 across different pitch registers (loRan – low register: ≤B♭2; lomiRan – lower middle register: ≤B♭3 and >B♭2; himiRan – upper middle register: ≤F4 and >B♭3; and hiRan – high register: >F4). Positive values indicate greater upper-lip force, negative values indicate greater lower-lip force. Background colours denote force distribution types: red for upper-lip dominance, blue for lower-lip dominance, and yellow for balanced distribution.
Current usage metrics show cumulative count of Article Views (full-text article views including HTML views, PDF and ePub downloads, according to the available data) and Abstracts Views on Vision4Press platform.
Data correspond to usage on the plateform after 2015. The current usage metrics is available 48-96 hours after online publication and is updated daily on week days.
Initial download of the metrics may take a while.