Figure B.1.
Download original image
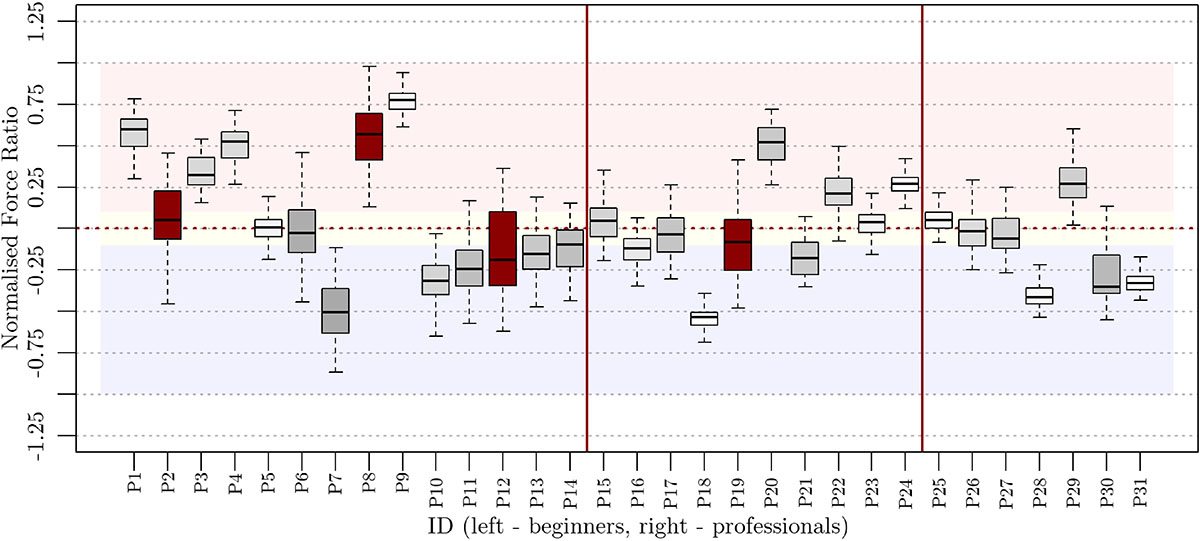
Boxplots of the normalised force ratio for notes from the easier section, ordered by proficiency level (left: beginners; right: professionals). Box shading encodes variability as the interquartile range (IQR), with darker shading indicating greater variability across notes. The four dark-red boxes highlight the participants with the highest interquartile ranges. The two dark-red vertical lines mark the boundaries between the theoretical proficiency groups (beginners, advanced, and professional musicians).
Current usage metrics show cumulative count of Article Views (full-text article views including HTML views, PDF and ePub downloads, according to the available data) and Abstracts Views on Vision4Press platform.
Data correspond to usage on the plateform after 2015. The current usage metrics is available 48-96 hours after online publication and is updated daily on week days.
Initial download of the metrics may take a while.