| Issue |
Acta Acust.
Volume 7, 2023
|
|
|---|---|---|
| Article Number | 47 | |
| Number of page(s) | 12 | |
| Section | Hearing, Audiology and Psychoacoustics | |
| DOI | https://doi.org/10.1051/aacus/2023042 | |
| Published online | 13 October 2023 | |
Scientific Article
Evaluation of impulse noise reduction in hearing aids with technical measurements and ratings of discomfort
1
German Institute of Hearing Aids, 23562 Lübeck, Germany
2
Universität zu Lübeck, 23562 Lübeck, Germany
3
Technische Hochschule Lübeck, 23562 Lübeck, Germany
* Corresponding author: This email address is being protected from spambots. You need JavaScript enabled to view it.
Received:
5
November
2022
Accepted:
17
August
2023
Abstract
Short, impulse-like sounds such as slamming of a door or rattle of dishes can be uncomfortable for hearing aid users. Therefore, many hearing aids provide impulse (or transient) noise reduction (INR) that should reduce loud and short sounds without impairing desired signals. In this work, we want to address the question whether hearing aid users require this type of signal processing to experience impulse sounds similarly as normal-hearing listeners. For this purpose, we evaluated INR in six commercially available hearing aids with technical measurements and with test subjects. During the technical evaluation, we presented seven different impulse signals to the hearing aids attached to a head and torso simulator (HATS) and determined the C-weighted peak sound pressure levels (LC,peak) at the output in different configurations. For the evaluation with test subjects, the discomfort of the same impulse sounds was rated by 24 hearing-impaired and 20 normal-hearing subjects. All subjects rated the discomfort unaided, and the hearing-impaired subjects also while successively wearing all six hearing aids with and without activated INR. As a main conclusion, hearing aid users without INR did not experience more discomfort compared to normal-hearing listeners for most of the impulse signals tested including the most uncomfortable ones, but INR further reduced experienced discomfort. Moreover, the technical measurements were correlated with the subjective ratings on discomfort.
Key words: Hearing aid / Impulse noise reduction / Transient noise reduction / Loudness discomfort / Peak sound pressure level
© The Author(s), Published by EDP Sciences, 2023
 This is an Open Access article distributed under the terms of the Creative Commons Attribution License (https://creativecommons.org/licenses/by/4.0), which permits unrestricted use, distribution, and reproduction in any medium, provided the original work is properly cited.
1 Introduction
In everyday life, we are surrounded by different types of sounds, which can be useful for the perception of the environment and for orientation. However, sounds can also have negative effects on speech intelligibility, listening effort, or comfort [1, 2], and in this regard they are referred to as noise. Especially hearing-impaired people with and without hearing aids face challenges in noisy environments such as reduced speech intelligibility or increased listening effort [1]. Therefore, signal processing in hearing aids includes various features to reduce noise and/or increase the desired signals, i.e., mostly speech. Common features are directional microphones, gain reduction for noise [3], noise reduction for speech enhancement (NRSE) [3, 4], wind noise reduction, and impulse noise reduction (INR). In addition, other general features of hearing aids such as multiple hearing aid channels with compression (CR) and an output limiter (OL) can also be helpful to reduce negative effects of noise for hearing aid users [5–8].
In this work, we focus on INR in hearing aids, which is commonly also referred to as transient noise reduction. This feature aims at reducing the annoyance or discomfort caused by very short sounds such as slamming of a door or rattle of dishes [9, 10]. These impulse signals are characterized by a fast increase in amplitude and high sound pressure levels [11]. Some studies report that impulse sounds are particular uncomfortable for hearing aid users [12]. However, other studies show that an increase in discomfort is noticed only within a relative comparison between the aided and unaided condition, and not within a comparison with normal-hearing listeners [13, 14]. There are several studies evaluating the benefit of INR, however, the methods and outcomes differ among these studies [15–19]. Most studies report a positive effect of INR when test subjects were asked to rate annoyance, sound quality or loudness comfort. If speech intelligibility is considered, it is commonly understood that INR should have no negative impact, which was demonstrated in all studies considered. In turn, no benefit of INR regarding speech intelligibility was observed in most studies [9, 10, 16–18]. A positive effect of INR on speech intelligibility could only be observed in situations with a very high density of impulse sounds, e.g. in [15] where multiple exemplars of chair clang sounds masked approximately half of a sentence.
Based on previous research on INR in hearing aids, we want to address the open question: Do hearing aid user require INR to experience impulse noise comparable to people without hearing loss, or does INR make impulse noise more bearable than for people with normal hearing?
To this end, we selected six commercially available hearing aids from different manufacturers to represent the current state-of-the-art of INR, as most aforementioned studies are now over 10 years old and only include research devices or a limited number of commercially available devices. First, we evaluated the effect of INR in technical measurements on a head and torso simulator (HATS). Moreover, we compared the effect of INR with other features that can potentially also reduce loud impulse sounds, such as CR, an OL, and NRSE. Second, we invited 24 hearing-impaired and 20 normal-hearing test subjects, which rated the annoyance of nine different impulse sounds. The hearing-impaired subjects rated the signals while successively wearing all six hearing aids with and without activated INR. Furthermore, all test subjects rated the impulse sounds without hearing aids. A comparison of the ratings of the hearing-impaired subjects in all conditions with the ratings of the normal-hearing subjects gives deep insight into the benefit and need of INR in hearing aids.
2 Material and methods
2.1 Impulse noise recordings and playback
Nine different impulse signals were recorded at 1 m distance with a Brüel & Kjær 1/4″ microphone of type “4939” and a sample rate of 96 kHz in an anechoic test room (see Tab. 1 and Fig. 1). We determined the C-weighted peak sound pressure levels LCpeak (i.e., absolute maximum of waveform magnitude) according to IEC 61672. This permits reproducible measurements [20] and it is a common way to characterize impulse sounds [21]. Each signal was recorded multiple times, and the signal nearest to the average of LCpeak of all signals was selected for further use in this study. All impulse sounds are openly available.
 |
Figure 1 Visualization of the impulse noise signals recorded. A short description of the signals is given in Table 1. All impulse sounds are openly available at https://doi.org/10.5281/zenodo.8112384 [36]. |
Overview about the impulse sounds. The third column contains the C-weighted peak sound pressure levels as recorded and as intended during playback. The forth column lists the sound pressure levels measured in a free field (FF) and measured with the ear simulators of the HATS representing the sound pressure at eardrum (ED).
During playback, the signals were presented with the same sample rate of 96 kHz through a Genelec 8351A coaxial loudspeaker in an audiological test room at 1 m distance to the test subjects or HATS (see Fig. 2). In both cases, the output sound pressure levels were mostly the same as recorded. However, due to technical and ethical reasons, we decided to reduce the bursting balloon (S1) and the starter clapper (S9) to an unweighted peak sound pressure level of 120 dB, which resulted in C-weighted peak sound pressure levels of 118.8 dB(C) and 117.2 dB(C), respectively (see third column of Tab. 1). The loudspeaker was free-field equalized such that its pseudo-anechoic impulse response approximated that of a second-order minimum-phase Butterworth bandpass filter between 50 and 19,845 Hz [22]. This minimized both spectral and temporal effects of the loudspeaker playback on the impulse signals. As a check, playbacks of the impulse signals were recorded in a free field and the C-weighted peak sound pressure levels of the signals played back were compared to the intended values (see left values of the fourth column of Tab. 1). A root mean square (RMS) error across signals of 1.5 dB and a maximum difference of −3.7 dB for the starter clapper was observed. In addition, an equalization was performed on every measurement day to ensure that the loudspeaker frequency response from 100 Hz to 10 kHz was flat within a tolerance of ±2 dB.
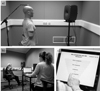 |
Figure 2 Photograph of the technical measurement setup with the HATS (a) and the setup for the ratings of discomfort (b). Moreover, (c) shows the presentation of the rating scale on a touchscreen. |
2.2 Study design for the technical measurements
During the technical evaluation, we presented the impulse signals to the hearing aids attached to a HATS and determined the C-weighted peak sound pressure levels (LC,peak) at the output. As HATS we used a KEMAR from GRAS Type 45-BC9 (anthrompometric pinnae + mouth simulator) which meets the specifications of IEC 60318-7 and which includes two ear simulators according to IEC 60318-4. Consequently, all technical measurement results presented in this work are related to the sound pressure level at eardrum. To show how these results differ from the free field, the fourth column of Table 1 includes measurement results in a free field (without HATS) as well as at the ear simulators of the HATS with open ears. On average, the C-weighted peak sound pressure levels related to the eardrum are approx. 11 dB higher than in a free field.
All test signals were presented in quiet five times in a row with a break of 5 s in between for all settings mentioned in the Section 2.4. Moreover, the signal S8 (keychain dropped) was also presented within a pause of the International Speech Test Signal (ISTS) [23]. To this end, the ISTS was played at 65 dB SPL for 18.9 s, followed by a pause of 0.1 s, and then the impulse signal started after 19 s. The gap of 0.1 s was introduced to clearly separate the impulse sound from speech. After the impulse sound, the last 7 s of the selected ISTS sequence (from 11.9 s to 18.9 s) was repeated. With this additional measurement, not only the effect of speech on the reduction of the impulse signal, but also the effect of the different settings on the speech signal before and after the impulse were investigated. The signal S8 was chosen for this investigation, since it is a realistic everyday sound and it is one of the three signals rated with highest discomfort.
2.3 Study design for the ratings of discomfort
2.3.1 Test subjects
Twenty-four hearing-impaired subjects (10 male, 14 female) aged between 57 and 86 years (M = 75, SD = 7.8) with a hearing loss near to type N3 according to IEC 60118-15 [24] were recruited from a subject database of the Audiological Campus Lübeck (see Fig. 3). That means the subjects were experienced test candidates, who regularly participated in the training of hearing aid professional students or in scientific studies. The difference in pure tone average at 0.5, 1, 2, 4 kHz (PTA) between the left and right ear was below ±20 dB for all subjects (M = 0.2 dB, SD = 5 dB), and their hearing aid experience was at least two years (M = 10.7, SD = 6.3). Moreover, 20 test subjects (10 male, 10 female) aged between 22 and 44 years (M = 27, SD = 5.1) with normal hearing according to ISO 8253-3 [25] were recruited from students and members of the University of Lübeck.
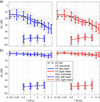 |
Figure 3 Results of the pure tone audiometry for the hearing threshold (HT) and uncomfortable loudness level (UCL) of the 24 hearing-impaired (a) and 20 normal-hearing subjects (b). For the hearing-impaired subjects, also the HT of type N3 according to IEC 60118-15 is plotted. The error bars indicate plus/minus one standard deviation. For some measurements with the hearing-impaired subjects, the audiometer limit of 120 dB HL was reached and those values are omitted in the plot of the individual data as well as for the computation of the mean values. Overall, data of two subjects for the HTs and data of five subjects for the UCLs were affected. |
2.3.2 Pure tone audiometry
Before the actual test started, the hearing threshold (HT) for pure tones was measured via headphones at frequencies of 0.125, 0.25, 0.5, 0.75, 1, 1.5, 2, 3, 4, 6, and 8 kHz. In addition, the individual uncomfortable loudness levels (UCLs) were measured with pure tones at 0.5, 1, 2, and 4 kHz. The results for the hearing threshold (HT) and UCL are plotted for all subjects in Figure 3. In addition, the HT of type N3 according to IEC 60118-15 is plotted for the hearing-impaired subjects. The error bars indicate one standard deviation above and below the mean thresholds. For some measurements with the hearing-impaired subjects, the audiometer limit of 120 dB HL was reached and those values are omitted in the plot of the individual data as well as for the computation of the mean values. Overall, data of two subjects for the HT and data of five subjects for the UCL were affected.
2.3.3 IHS questionnaire
All subjects completed a German translation of the Inventory of Hyperacusis Symptoms (IHS) questionnaire [26]. The scores for the IHS questionnaire was below 69 for all hearing-impaired (M = 42; SD = 11.6) as well as for all normal-hearing subjects (M = 39; SD = 6.7), which indicates no signs of hyperacusis.
2.3.4 Ratings of discomfort
During the actual test, the subjects rated the level of discomfort within the following five categories (original ratings in German are shown after the slash): “not uncomfortable (not u.)/nicht unangenehm”, “little uncomfortable (lit. u.)/wenig unangenehm”, “uncomfortable (u.)/unangenehm”, “very uncomfortable (very u.)/sehr unangenehm”, and “extremely uncomfortable (ext. u.)/extrem unangenehm”. It was also possible to rate the stimuli between two categories, so that overall a nine point scale was used (see Fig. 2b and 2c). The subjects gave their ratings on a touchscreen showing an appropriate Graphical User Interface (GUI) with nine buttons as shown in Figure 2c. The width of the buttons on the touchscreen was linearly increased from not uncomfortable to extremely uncomfortable. This visualization of the buttons was used to interpret the ratings on an interval scale rather than an ordinal scale.
All impulse signals were presented in randomized order with a break of 5 s after each subject response. During one cycle, the test subjects had to rate the complete set of impulse signals five times. Each cycle thus contained 45 stimuli. The normal-hearing subjects completed one cycle without hearing aids during one appointment. The hearing-impaired subjects completed one cycle without hearing aids, and each one cycle while wearing six different pairs of hearing aids with activated and deactivated INR (13 cycles), split into two appointments. The order of the hearing aids was randomized using a Latin square. Due to practical reasons, the two settings with activated and deactivated INR were completed in a row for each hearing aid where both settings were equally often at first and second position across test subjects. Moreover, the unaided condition was always completed at the beginning of the second appointment.
The study design was approved by the ethics committee of the University of Lübeck (file number 21-241).
2.3.5 Sequence of measurements
During one cycle, the test subjects rated each of the nine impulse signals five times which took approx. 10 min. The normal-hearing subjects completed one cycle without hearing aids in one appointment, which took approx. 30 min together with audiometry and IHS questionnaire. The hearing-impaired subjects completed 13 cycles in two appointments. During the first appointment, the audiometry, IHS questionnaire, and ratings with three different pairs of hearing aids without and with activated INR were completed (6 cycles) which took approx. 2.5 h. During the second appointment, first, the ratings in the unaided condition and then the ratings with the remaining three types of hearing aids were completed (7 cycles) which took approx. 2 h. The time between two appointments was at least one day and no more than five days (M = 1.6d).
2.4 Hearing aids and fitting
2.4.1 Type and model
Six pairs of commercially available behind-the-ear (BTE) hearing aids released between 2017 and 2021 were selected for this study. In Table 2, all devices are listed in alphabetical order. A benchmark of the devices was not intended so the assignment to the results is not disclosed. In the right column, the available settings for the INR in the fitting software are listed. Moreover, the default setting for a hearing loss of type N3 and a flat UCL of 100 dB HL suggested by the fitting software (First Fit) is underlined. We tried to gather detailed information about the realization of INR in the hearing aids selected. Most sources are white papers or similar designed for marketing purposes [27–29], i.e., the benefit or intention rather than the functionality is explained. For GN ReSound and Phonak, we found the European patents “EP 1 471 767 B1” from 2004 [30], and “EP 2 027 750 B1” from 2006 [31], respectively, and for Starkey the US patent “US 20160353214A1” [32]. Nonetheless, it is not clear how much of the content of these patents is still used in the devices considered. Common features for the detection of impulse sounds seem to be the fast increase in sound pressure level, the short duration, the absolute sound pressure level, and the sound pressure level relative to background sounds. However, information about exact control parameters, how impulse sounds are reduced, or how peaks of speech are distinguished from impulse sounds in commercial hearing aids is very limited.
List of hearing aids used in the study. In the right column, the available settings for INR in the fitting software are listed. The default setting for a hearing loss of type N3 and a flat UCL of 100 dB HL suggested by the fitting software (First Fit) is underlined. For the experiment of this study, the maximum setting was selected indicated with bold letters.
2.4.2 Fitting
The hearing aids were fitted according to NAL-NL2 [33] using real-ear measurements. For the test subjects, the individual hearing loss was used as input, and for the technical measurements the input was a hearing loss of type N3 according to IEC 60118-15 [24]. The settings of all features were left as suggested by the fitting software of the manufacturers. Only, INR was either deactivated (FIT INR OFF) or set to maximum effect (FIT INR ON).
The technical measurements additionally included a fitting of the hearing aids according to the functional test setting (FTS) as defined in IEC 60118-16 [3]. This means that all accessible features in the fitting software were manually disabled and a linear gain was applied. Using this setting as basis, four additional settings were tested where INR (FTS+INR), the OL (FTS+OL), CR (FTS+CR), and NRSE (FTS+NRSE) were separately set to maximum effect. For the setting FTS+CR this means a fast-acting compression was selected and the gain for high input levels was set to minimum while it was tried to keep the gains for lower and medium levels as during the FTS setting. This setting was included to check whether impulse sounds can trigger CR, which may reduce impulse sounds but can also lead to an attenuation of desired signals after the impulse.
2.4.3 Coupling
The hearing aids were coupled to the HATS and test subjects via a standard sound tube with an inner diameter of 2 mm. For the HATS and half of the hearing aid users, a foam plug was utilized. For the other half of the hearing aid users, a custom earmold was available and could be used for the study. An important feature of the coupling is the venting, which affects various important properties such as the maximum sound pressure level at lower frequencies, the amount of leakage (direct) sounds, the feedback path, the occlusion effect, or own voice perception [34]. Due to the nature of impulse sounds, most of the energy is at higher frequencies. Therefore, we expect that the vent size has no strong impact on the way impulse sounds are processed and emitted by the hearing aids. Nevertheless, the subjective ratings could indirectly be impaired, e.g., due to poor own voice perception. Therefore, we decided to use no venting for the technical measurements, and a typical vent size of 1.4 mm for the hearing aid users. For the foam plugs, the venting was realized with another smaller tube with the intended diameter and a length of approx. 11.5 mm.
2.4.4 Verification
For both the technical measurements and the ratings of discomfort, the gain targets and the settings of the OL were verified. For the measurements with test subjects, the hearing aid output was measured with probe microphones in front of the ear drum (real ear measurements, REM), and for the technical measurements the output of the ear simulators of the HATS was considered. The gain targets according to NAL-NL2 were checked with the International Speech Test Signal (ISTS) according to IEC 60118-15 at levels of 55, 65, and 80 dB SPL. As targets for the OL, the individual UCLs of the test subjects were used, and for the technical measurements, a UCL of 115 dB HL was considered. To check the targets, the EUHA MPO signal was presented as test signal as described in the guidelines of the European Union of Hearing Aid Acousticians (EUHA) [35]. The EUHA MPO test signal is a mixture of the ISTS at 55 dB SPL and short sinusoidal bursts with a duration of 250 ms at a sound pressure level of 90 dB SPL at frequencies of 500 Hz, 1 kHz, 2 kHz, 3 kHz, and 4 kHz.
2.5 Reliability of the technical measurements
2.5.1 Fluctuations within repetitions
During the technical measurement, 7 settings, 6 hearing aids, and 9 signals were recorded on both ears with 5 repetitions each. Furthermore, the signal keychain dropped was also presented within a pause of the ISTS for all settings and hearing aids. Considering LCpeak of each ear separately, the standard deviation between repetitions in the 840 conditions (7 × 6 × 9 × 2 in quiet plus 7 × 6 × 1 × 2 within a pause of the ISTS) were below 0.36 dB in 50%, below 2.2 dB in 95% and below 3.8 dB in 99% of all conditions. The highest standard deviation of 6.8 dB was observed for HA6 for the setting FIT INR ON and the signal slamming of a book.
2.5.2 Symmetry of data across ears
For each ear of the HATS, the mean of LCpeak of the five repetitions and the difference between ears was computed. The mean of all differences was −0.46 dB and the standard deviation was 1.6 dB. If we look at the absolute differences, 50% of the values were ≤0.81 dB, 95% were ≤3.4 dB, and 99% were ≤5.7 dB. The maximum absolute difference of 8.7 dB was found for HA6 for the setting FTS+INR and the signal rattle of cutlery. This shows that the results of most hearing aids were symmetric but there was one manufacturer with higher asymmetries which is the same that showed the highest variability between repetitions.
3 Results
3.1 Technical measurements
3.1.1 Effect of INR
In Figure 4, the averages of LCpeak across the five repetitions and the left and right ear of the HATS are depicted. In panel (a), all results are visualized in a scatter plot for the setting FIT INR OFF versus FIT INR ON. Most of the values lie below the curve y = x, which represents a reduction of LCpeak due to the activation of INR. Nevertheless, there were also some hearing aids that for some stimuli showed no reduction, i.e., y = x. A Pearson’s correlation coefficient was computed to assess the relationship between the peak sound pressure levels in both settings. There was a positive, statistically significant correlation (rp = .73, p < .001, N = 52). A regression line fitted to all data points has a slope of 0.75 (see dashed line in panel (a)) which indicates a stronger reduction with increasing peak sound pressure level. Furthermore, in Figure 4, the difference of LCpeak between the settings FIT INR OFF and FIT INR ON are depicted grouped after the type of hearing aid (b) and type of stimulus (c). The activation of INR caused a reduction of peak sound pressure level of up to 20 dB. On average across stimuli, the reduction was highest for HA4 with 13 dB and lowest for HA5 with 4 dB. If we look at the reduction averaged across hearing aids, we see that the reduction was highest for S6 (glass put on table) with 13 dB. Moreover, the signals S2 (rattle of cutlery) and S5 (glass clink) with the lowest input peak sound pressure levels (see LCpeakPlay in Tab. 1) showed the lowest reductions of 4 dB and 6 dB, respectively. One exception was HA4, which reduced S2 and S5 by 14 dB and 19 dB, respectively.
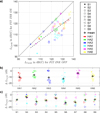 |
Figure 4 Effect of INR on the C-weighted peak sound pressure level LCpeak at the hearing aid output for a state-of-the-art fitting. For all plots, the average of the repetitions of the left and right ear of the HATS was computed first. Different stimuli are represented by different symbols and different hearing aids by different colors. (a) Scatter plot of LCpeak for the setting FIT INR OFF versus FIT INR ON. (b) Difference of LCpeak between the settings FIT INR OFF and FIT INR ON grouped after the type of hearing aid and (c) the type of stimulus. |
For a statistical evaluation, the differences in C-weighted peak sound pressure level between the state-of-the-art fitting with and without INR were considered (FIT INR OFF and FIT INR ON). We verified that the differences between repetitions for all hearing aids, stimuli, and the left and right ear of the HATS are normally distributed using the Shapiro-Wilk test with Bonferroni corrections. Next, a three-way ANOVA for the factors “hearing aid”, “stimulus”, and “ear” was performed, taking interactions between two factors into account. The ANOVA revealed a significant effect of “hearing aid” F(5,472) = 327, p < .001*** and “stimulus” F(8,472) = 171, p < .001*** and their interaction F(40,472) = 84.1, p < .001***. For the factor “ear”, the interaction with “hearing aid” F(5,472) = 3.33, p < .01*** was significant, but there was no main effect. This is in agreement with the observation in the Subsection 2.5.2, i.e., most hearing aids showed a symmetric behavior but there is one manufacturer with higher asymmetries. Since there was no statistically significant main effect for the factor “ear”, the data of the left and right ear of the HATS were considered together for the next analysis.
A one-sample t-test with Bonferroni correction was performed for the differences in C-weighted peak sound pressure level of all 5 repetitions between FIT INR OFF and FIT INR ON. The resulting p-values for all hearing aids and stimuli are listed in Table 3 which show that 26 of 36 differences were statistically significant.
Bonferroni corrected p-values of the one-sample t-test on the differences in C-weighted peak sound pressure level between the state-of-the-art fitting with and without INR for all hearing aids and stimuli.
3.1.2 Effect of individual features
Using the setting FTS as basis, the following four additional settings were tested: FTS+CR, FTS+OL, FTS+NRSE, and FTS+INR. With these additional settings, the individual effects of features other than INR that possibly affect impulse signals were investigated. To this end, the difference of the C-weighted peak sound pressure levels relative to the setting FTS was considered (∆LCpeak). In Figure 5a, the averages across all five repetitions of both ears are depicted. The data of HA2 for the settings FTS+CR and FTS+OL were excluded, because CR was coupled with the settings of the OL so that the individual programming of each feature in the fitting software was not possible. For a statistical evaluation, the five repetitions of both ears were considered (n = 10). Performing a three-way ANOVA for the factors “setting”, “hearing aid”, and “stimulus” revealed a significant effect (p < .001) for all factors and their interactions. Moreover, a one-sample t-test with Bonferroni correction shows that ∆LCpeak for all conditions was statistically significantly different from zero. Since the variance of ∆LCpeak for the five repetitions of both ears was very low for these artificial settings, even small differences were statistically significant, e.g., see the mean values for the setting NRSE in Figure 5a. If we focus on practical relevance, a meaningful reduction of the impulse signals was observed for the activation of the OL and INR, only. Moreover, CR also showed a weak effect in the range of −5 to +10 dB and on average of 0.9 dB, while NRSE had no relevant effect.
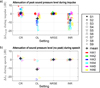 |
Figure 5 In panel (a), the C-weighted peak sound pressure levels of all impulse signals for the settings FTS+CR, FTS+OL, FTS+NRSE, and FTS+INR relative to the values of setting FTS (∆LCpeak) are plotted (for the measurements without speech). In panel (b), the C-weighted sound pressure levels (no peak) during the 7 s long speech signal before the impulse signals for the settings FTS+CR, FTS+OL, FTS+NRSE, and FTS+INR relative to the values of setting FTS (∆LC) are plotted for the signal keychain dropped (for the measurements with speech). In both panels the data of HA2 for the settings FTS+CR and FTS+OL were excluded, because CR was coupled with the settings of the OL so that the individual programming of each feature in the fitting software was not possible. For both plots, the average across repetitions and ears of the HATS are considered. |
3.1.3 Presentation of impulse sounds within speech
As mentioned in the methods section, the signal keychain dropped was also presented within a pause of the ISTS. First, we investigated whether the presence of speech has an influence on the processing of the impulse sounds for the state-of-the-art fittings (FIT INR OFF, FIT INR ON) as well as the test settings (FTS, FTS+CR, etc.). For this purpose, the differences between the C-weighted peak sound pressure levels of the presentation in quiet and within the speech pause were computed, which were in the range of ±2 dB for almost all settings and hearing aids. Only two values of HA6 were out of this range for the settings FIT INR ON and FTS+INR with −3.9 dB and +3.9 dB, respectively. Hence, we conclude that the presence of speech had no clinical relevant effect on the processing of the impulse sounds in our experiment.
Second, we evaluated how speech after an impulse sound was reduced by INR. Since the same sequence of the ISTS was presented before and after the impulse, the C-weighted equivalent sound pressure levels (no peak level) of the ISTS before and after were compared to each other. To this end, the state-of-the-art fittings were considered only. Moreover, a long and short interval of 7 s and 0.9 s (each before and after the impulse) were evaluated. The difference for the long interval were between −1.1 and 0.3 dB for FIT INR OFF and between −0.9 and 0.4 dB for FIT INR ON, and for the short interval between −2.6 to 0.2 dB for FIT INR OFF and −2.5 to 0.6 dB for FIT INR ON. Negative values indicate that the sound pressure level after the impulse was lower than before the impulse. These results suggest that speech is slightly reduced after the occurrence of an impulse sound, especially during the first second (shorter interval) whether or not INR was activated, but the magnitude of reduction has no clinical relevance.
Finally, the effect of the individual features on the speech signal was analyzed considering the test settings. For this purpose, the C-weighted equivalent sound pressure levels of the 7 s long intervals of the ISTS before the impulses were computed. Then, the differences between the setting FTS and all other test settings (FTS+OL, FTS+INR, FTS+CR, FTS+NRSE) were calculated, which are depicted in Figure 5b for the averages across all five repetitions of both ears. A negative value in Figure 5b indicates that the speech level was lower with activated feature compared to FTS. As explained above, the data of HA2 for the settings FTS+CR and FTS+OL were also excluded in this plot. For a statistical evaluation, the differences between the five repetitions of both ears were considered (n = 10). A two-way ANOVA for the factors “setting”, and “hearing aid” revealed a significant effect (p < .001) for all factors and their interactions. Moreover, a one-sample t-test with Bonferroni correction was performed for all conditions. This shows that the differences in 15 of 20 conditions were statistically significant different from zero. However, a practically relevant and statistically significant reduction of the impulse signals was observed for the activation of the OL for HA3, HA5, and HA6, only (see Fig. 5b).
3.2 Ratings of discomfort
3.2.1 Comparison of normal-hearing and hearing-impaired subjects
The ratings of the normal-hearing and hearing-impaired subjects were compared for all stimuli (see Fig. 6). To this end, the average across the five repetitions was computed for each subject and condition. Moreover, for the hearing-impaired subjects with hearing aids, the data was also averaged across all six types of hearing aids. In Figure 6, the results are visualized as boxplots. For the hearing-impaired subjects, the first condition is unaided (HI), the second condition (HI, INR OFF) is aided with the fitted setting and INR deactivated, and the third condition (HI, INR ON) is also aided but with INR activated. Next, the results of the hearing-impaired subjects were compared to the data of the normal-hearing subjects using the Mann–Whitney U-test. For the three conditions and nine stimuli, the Bonferroni corrected p-values (for 27 comparisons) are listed in Table 4. Without hearing aids, there were no statistical significant differences between the normal-hearing and hearing-impaired subjects’ rating of discomfort. Nonetheless, a trend can be noticed that without hearing aids, for most stimuli the HI subjects reported less discomfort than the NH subjects. With hearing aids and deactivated INR, the hearing-impaired subjects rated the discomfort for S5 and S6 significantly higher compared to the normal-hearing subjects. With activated INR, this difference was not significant for S6 anymore, but a significant difference remained for S5. Furthermore, the hearing-impaired subjects with hearing aids and activated INR experienced statistically significant less discomfort for S1 and S9 compared to the normal-hearing subjects.
 |
Figure 6 Ratings of discomfort not uncomfortable (not u.) to extremely uncomfortable (ext. u.) of the normal-hearing (NH) and hearing-impaired (HI) subjects for all nine stimuli as listed in Table 1. For the hearing-impaired subjects, the first condition is without hearing aids (HI), the second (HI, INR OFF) and third condition (HI, INR ON) with hearing aids programmed with the settings FIT INR OFF and FIT INR OFF, respectively. For the conditions with hearing aids, the results of all six types of hearing aids were averaged. |
3.3 Comparison of different conditions of the hearing-impaired subjects
The hearing-impaired subjects rated the discomfort of the impulse signals unaided (HI), and aided with deactivated INR (HI, INR OFF), and with activated INR (HI, INR ON). These three conditions were compared to each other using the Wilcoxon signed rank test. The Bonferroni corrected p-values (for 27 comparisons) are listed in Table 5. Relative to the unaided condition, hearing aids significantly increased discomfort ratings for all stimuli except S1 and S2. Activating INR in the hearing aids then significantly decreased discomfort ratings for all stimuli except S2 and S5. Relative to the unaided condition, the INR feature significantly reduced discomfort ratings for one stimulus (S1). For stimuli S3–S7, discomfort was rated significantly higher with INR activated than when unaided.
3.2.3 The effect of INR depending on type of stimulus and type of hearing aid
The effect of INR on the mean ratings with respect to type of hearing aid and type of stimulus was investigated. For this purpose, the ratings of discomfort were averaged across the hearing-impaired subjects for the settings FIT INR OFF and FIT INR ON. In Figure 7, this data is visualized as a scatter plot (a) and grouped after the type of hearing aid (b) and type of stimulus (c). In Figure 7b and 7c, the left values correspond to the setting FIT INR OFF and the right values to the setting FIT INR ON. One can see that the mean is decreasing from FIT INR OFF to FIT INR ON for almost all data of Figure 7b and 7c. This difference in mean was statistically tested using the Wilcoxon signed rank test. The Bonferroni corrected p-values for the data grouped after the type of hearing aid are listed in Table 6. The p-values for the data grouped after the type of stimulus are already listed in Table 5 (see column “HI, INR OFF – HI, INR ON”). In Table 6, we can notice that the activation of INR significantly reduced the ratings of discomfort for all hearing aids considered.
 |
Figure 7 Ratings of discomfort averaged across hearing-impaired subjects with hearing aids for the settings FIT INR OFF and FIT INR ON visualized as a scatter plot (a) or grouped after the type of hearing aid (b) or the type of stimulus (c). In (b) and (c), the left values correspond to the setting FIT INR OFF and the right values to the setting FIT INR ON. |
Bonferroni corrected p-values (for 6 comparisons) of the comparison between the ratings of the hearing-impaired subjects for the setting FIT INR OFF and FIT INR ON with respect to the type of hearing aid using the Wilcoxon signed rank test. The corresponding mean values of the data are depicted in Figure 7b.
3.3 Comparison of the technical evaluation and ratings of discomfort
To compare the technical evaluation with the ratings of discomfort, in Figure 8, the mean ratings of the test subjects are plotted against the C-weighted peak sound pressure levels (LCpeak) measured at the ear simulators of the HATS. For the normal hearing test subjects (NH), peak sound pressure levels of the HATS with open ears were considered, and those values are plotted with black symbols in Figure 8. The values of the hearing impaired subjects are color coded depending on the type of hearing aid. Moreover, the symbols for the settings FIT INR OFF and FIT INR ON are marked with a horizontal (“–”) and vertical (“|”) black line, respectively. A Spearman’s rank-order correlation was run to determine the relationship between LCpeak and the mean ratings of discomfort. There was a moderate to strong, positive correlation between these variables, which was statistically significant (rs = .72, p < .001, N = 117). A significant positive relation means that higher peak levels were associated with higher rankings of discomfort. In addition, Spearman’s rank-order correlation was run for the individual data (not plotted), which shows a weak to moderate, positive, and statistically significant correlation (rs = .44, p < .001, N = 2772).
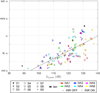 |
Figure 8 Scatter plot of the C-weighted peak sound pressure levels measured at the ear simulators of the HATS against the mean ratings of discomfort. The type of symbol indicates the type of stimulus. Black symbols correspond to the normal hearing test subjects (NH), and the values of the hearing impaired subjects are color coded depending on the type of hearing aid. Moreover, the settings of the hearing aids FIT INR OFF and FIT INR ON are marked with a horizontal (“–”) and vertical (“|”) black line, respectively. |
4 Discussion
4.1 Benefit of INR
If INR is activated in current state-of-the-art hearing aids with a state-of-the-art fitting, a reduction of the C-weighted peak sound pressure level of up to 20 dB was measured during the technical evaluation on the HATS (see Fig. 4). On average across stimuli and hearing aids, a reduction of 9 dB was observed. The amount of reduction of an impulse signal depended on the stimulus and type of hearing aid, where an interaction occurred. On average across hearing aids (see Fig. 4c), the stimulus S2 (rattle of cutlery) and S5 (glass clink) with the lowest input peak sound pressure levels (82 dB(C) and 86 dB(C)) were reduced the least. However, HA4, which showed the highest reduction of 13 dB on average across stimuli (see Fig. 4b), also clearly reduced the levels of S2 and S5. These results suggest different strategies and / or parameter tuning for INR used in different hearing aids. If we look at the ratings of discomfort, on average across stimuli (see Fig. 7b), the activation of INR significantly reduced the discomfort for all hearing aids (see Tab. 6). On average across hearing aids (see Fig. 7c), also a significant reduction of discomfort was noticed for almost all stimuli except for S2 (see Tab. 5). For S2, apparently, a flooring effect occurred, because the ratings with and without activated INR were already near to the lowest category not uncomfortable. Compared to previous studies [9, 10, 16], these results show that today INR is no unique selling point but a common feature across hearing aid manufacturers, which does not mean that INR is included in all price levels of one manufacturer.
4.2 INR compared to other features
Beside INR, the effect of CR, the OL, and NRSE on impulse signals was investigated. For this purpose, first, a linear gain setting according to FTS as defined in IEC 60118-16 was programmed to the hearing aids, and then each feature was activated separately. In Figure 5a, the difference in C-weighted peak sound pressure level between the individual activation of a feature and FTS is depicted. As expected, the activation of NRSE showed no effect, since this type of signal processing is typically based on an analysis over multiple time frames and thus reacts too slowly for impulse signals. CR showed an effect in the range of −5 to +10 dB, but the average of 0.9 dB was close to zero. For the activation of CR, the gain settings needed to be adapted and the linear gain was not checked again. Consequently, the linear gain may have changed, which could be a reason for the positive and negative differences. On average a practically relevant reduction of impulse signals occurred for the activation of the OL and INR, only. Here, a reduction up to −20 dB and on average about −6 dB to −7 dB was observed. One could therefore wrongly conclude that an OL provides the same functionality as INR. However, if we look at the results of Figure 5b, the difference between both features is revealed. As mentioned before, for the stimulus S8 (keychain dropped), measurements within a pause of the ISTS were performed. In Figure 5b, the C-weighted equivalent sound pressure of the ISTS 7 s before the impulse is plotted. On average this sound pressure level was decreased by −11 dB for the OL whereas INR had no noticeable impact. Thus, the OL can reduce impulse signals but may also reduce the desired signals such as speech. In our measurements, only the activation of INR reduced the impulse signals without significantly changing the sound pressure level of the speech signal. This is in agreement with the desired behavior of INR and the results of previous studies and manufacturers’ marketing claims [9, 10, 16–18].
4.3 Technical measurements as a predictor for discomfort due to impulse sounds
Compared to previous studies, data of technical measurements and subjective ratings were collected under carefully matched conditions, i.e., equal stimuli, setup, sound reproduction, hearing aids, and with a comparable fitting. This allowed for a direct comparison of the results of the technical measurements with ratings on discomfort. Spearman’s rank order correlation between the C-weighted peak sound pressure levels and the ratings of discomfort was statistically significant for the individual data as well as for the average across test subjects (see Fig. 8). The correlation coefficient was higher for the mean data (rs = .72) compared to the individual data (rs = .44). This was expected, since the technical evaluation was performed on a HATS, which represents the acoustical characteristics of a median human and ear. Moreover, the measurements on the HATS did not include any variations of the hearing aid fittings, which were based on the individual hearing thresholds and UCLs. It is possible that a higher correlation for the individual data could be reached, if the C-weighted peak sound pressure levels would have been measured on the individual level with real ear measurements. Furthermore, considering temporal and spectral properties of the impulse signals, as done in loudness models, may further increase the correlation. However, if the mean across test subjects is of interest only, as in the present study, the C-weighted peak sound pressure level measured with a HATS seems to be a reasonable predictor for the experienced discomfort caused by impulse signals.
4.4 Discomfort of impulse signals for hearing aid users
If we look at the discomfort of impulse signals for hearing aid users, we have to consider that normal-hearing people without hearing aids also experience discomfort when listening to impulse signals. The results of the hearing-impaired subjects show that the discomfort in the aided condition was rated significantly higher for most of the impulse signals compared to the unaided condition (see Fig. 6 and Tab. 4) which is in agreement with previous findings [13, 14]. Compared to the ratings of normal-hearing subjects, however, the hearing-impaired subjects only rated two of nine stimuli (S5 and S6) significantly higher in the aided condition with deactivated INR and those signals were not rated with high discomfort (see Fig. 6). Since all hearing-impaired subjects were experienced hearing aid users, they were used to listen to amplified impulse sounds and may have acclimatized to amplification. Therefore, it is not clear, if new hearing aid users would experience comparable or higher discomfort in the same situation. Our results are similar to the findings of [13, 14] but do not support the conclusion of [12] that impulse sounds in general are particularly uncomfortable for hearing aid users. Interestingly, the three stimuli with the highest mean ratings of discomfort and the highest input peak sound pressure levels (S1, S8, S9) were not rated significantly more uncomfortable by the hearing aid users even with deactivated INR. A possible reason is that the OL was already active for those high sound pressure levels. Thus, it seems that hearing aid users without INR only experience more discomfort as normal-hearing listeners for stimuli with lower peak sound pressure levels, which were rated around the category little uncomfortable. If INR was activated, the discomfort was significantly decreased for seven of nine stimuli, but the discomfort for S5 was still rated higher compared to the normal-hearing listeners. Moreover, the hearing aid users with activated INR rated the discomfort significantly lower for the two stimuli with highest peak sound pressure levels (S1 and S9) compared to the normal-hearing listeners. In summary, already without INR experienced hearing aid users did not perceive most impulse sounds (including the loudest ones) as more uncomfortable than normal-hearing subjects, while state-of-the-art INR was able to reduce the discomfort further.
5 Conclusion
The technical measurements and the mean subjective ratings on discomfort likewise demonstrated the functionality and benefit of INR for all tested hearing aids. Thus, technical measurements, in particular the C-weighted peak level reaching the eardrum, can be a reasonable predictor for the average experienced discomfort. INR reduced impulse signals and the experienced discomfort without significantly affecting speech, which suggests that INR is a useful extension to other common features in hearing aids. The discomfort of most impulse sounds seems to be higher in the aided compared to the unaided condition. However, this should not be interpreted as hearing aid users suffer from impulse sounds more than normal-hearing listeners. Hearing aid users without INR only experienced more discomfort compared to normal-hearing listeners for some signals rated around little uncomfortable. Most of the impulse signals in this condition were not rated differently as by normal hearing listeners, including the most comfortable ones. INR may even experience reduce the experienced discomfort due to some impulse sounds compared to normal-hearing listeners. We conclude that experienced hearing aid users without specific sensitivity to noise do not particularly suffer from impulse sounds compared to normal-hearing people, already without INR.
Conflict of interest
Authors declare no conflict of interest.
Data availability statement
The impulse sounds utilized in this study are available under the Creative Commons CC-BY-SA 4.0 licence at https://doi.org/10.5281/zenodo.8112384 [36].
References
- M. Krueger, M. Schulte, M.A. Zokoll, K.C. Wagener, M. Meis, T. Brand, I. Holube: Relation between listening effort and speech intelligibility in noise, American Journal of Audiology 26 (Oct 2017) 378–392. [CrossRef] [PubMed] [Google Scholar]
- E.M. Picou, T.A. Ricketts: The relationship between speech recognition, behavioural listening effort, and subjective ratings. International Journal of Audiology 57 (Jan 2018) 457–467. [CrossRef] [PubMed] [Google Scholar]
- International Electrotechnical Commission: IEC 60118-16: electroacoustics – hearing aids – part 16: definition and verification of hearing aid features, 2022. https://webstore.iec.ch/publication/63325. [Google Scholar]
- H. Husstedt, J. Kreyenhagen, L. Langhof, S. Kreikemeier, F. Denk, S. Wollermann, M. Frenz: Using the phase inversion method and loudness comparisons for the evaluation of noise reduction algorithms in hearing aids. Acta Acustica 5 (2021) 41. [CrossRef] [EDP Sciences] [Google Scholar]
- A. Schaub: Digital hearing aids, Thieme, 2008. [Google Scholar]
- H. Dillon: Hearing aids, Thieme Publishers Series, Boomerang Press, 2012. [Google Scholar]
- M. Metz: Sandlin’s textbook of hearing aid amplification: technical and clinical considerations, Plural Publishing, 2014. [Google Scholar]
- G. Popelka, B. Moore, R. Fay, A. Popper: Hearing aids, in Springer Handbook of Auditory Research, Springer International Publishing, 2016. [CrossRef] [Google Scholar]
- D. Hayes: Transient impulse control for hearing aids. Hearing Review 13 (2006) 56. [Google Scholar]
- J. Chalupper, T.A. Powers: New algorithm is designed to take the annoyance out of transient noise. The Hearing Journal 60 (2007) 42. [CrossRef] [Google Scholar]
- International Organization for Standardization: ISO 10843: acoustics – methods for the description and physical measurement of single impulses or series of impulses, 1997. https://www.iso.org/standard/1179.html. [Google Scholar]
- A.R. Hernandez, J. Chalupper, T.A. Powers: An assessment of everyday noises and their annoyance. Hearing Review 13 (2006) 16. [Google Scholar]
- C.V. Palmer, R. Bentler, H.G. Mueller: Amplification with digital noise reduction and the perception of annoying and aversive sounds. Trends in Amplification 10 (2006) 95–104. [CrossRef] [PubMed] [Google Scholar]
- G. Keidser, E. Convery, J. Kiessling, R. Bentler: Is the hearing instrument to blame when things get really noisy? Hearing Review 16, 8 (2009) 12–19. [Google Scholar]
- J.J. DiGiovanni, E.A. Davlin, N.K. Nagaraj: Effects of transient noise reduction algorithms on speech intelligibility and ratings of hearing aid users. American Journal of Audiology 20 (2011) 140–150. [CrossRef] [PubMed] [Google Scholar]
- G. Keidser, A. O’Brien, M. Latzel, E. Convery: Evaluation of a noise-reduction algorithm that targets non-speech transient sounds. The Hearing Journal 60 (2007) 29. [CrossRef] [Google Scholar]
- H. Liu, H. Zhang, R.A. Bentler, D. Han, L. Zhang: Evaluation of a transient noise reduction strategy for hearing aids. Journal of the American Academy of Audiology 23 (2012) 606–615. [CrossRef] [PubMed] [Google Scholar]
- P. Korhonen, F. Kuk, C. Lau, D. Keenan, J. Schumacher, J. Nielsen: Effects of a transient noise reduction algorithm on speech understanding, subjective preference, and preferred gain. Journal of the American Academy of Audiology 24 (2013) 845–858. [CrossRef] [PubMed] [Google Scholar]
- M. Keshavarzi, T. Reichenbach, B.C.J. Moore: Transient noise reduction using a deep recurrent neural network: effects on subjective speech intelligibility and listening comfort. Trends in Hearing 25 (2021). [Google Scholar]
- H. Takinami: Peak C-weighted sound-pressure level. The Journal of the Acoustical Society of America 105 (1999) 1138–1138. [CrossRef] [Google Scholar]
- International Electrotechnical Commission: IEC 61672-1: 2013 electroacoustics – sound level meters – part 1: specifications, 2013. https://webstore.iec.ch/publication/5708. [Google Scholar]
- O. Kirkeby, P.A. Nelson: Digital filter design for inversion problems in sound reproduction. Journal of the Audio Engineering Society 47, 7/8 (1999) 583–595. [Google Scholar]
- I. Holube, S. Fredelake, M. Vlaming, B. Kollmeier: Development and analysis of an international speech test signal (ISTS). International Journal of Audiology 49, 12 (2010) 891–903. [CrossRef] [PubMed] [Google Scholar]
- International Electrotechnical Commission: IEC 60118-15: electroacoustics – hearing aids – part 15: methods for characterising signal processing in hearing aids with a speech-like signal, 2012. https://webstore.iec.ch/publication/793. [Google Scholar]
- International Organization for Standardization: ISO 8253-3: Acoustics – audiometric test methods – part 3: speech audiometry, 2022. https://www.iso.org/standard/74049.html. [Google Scholar]
- B. Greenberg, M. Carlos: Psychometric properties and factor structure of a new scale to measure hyperacusis: Introducing the inventory of hyperacusis symptoms. Ear and hearing 39, 5 (2018) 1025–1034. [CrossRef] [PubMed] [Google Scholar]
- Signia: Technikbroschüre – expertenwissen für hörgeräteakustiker [technical brochure – expert knowledge for hearing aid professionals]. Tech. Rep, Signia GmbH, 2016. [Google Scholar]
- L. Sjolander, M. Quilter, J. Groth: Hearing aid users show preference for resound impulse noise reduction. Tech. Rep., GN Hearing A/S, 2019. [Google Scholar]
- K. Walsh: Transient noise reduction. Tech. Rep., Starkey Laboratories, 2019. [Google Scholar]
- GN Resound: European patent EP 1 471 767 B1 – method and system for acoustik shock protection, 2004. [Google Scholar]
- Phonak: EU patent EP 2 027 750 B1 – method and system for acoustic shock detection and application of said method in hearing devices, 2006. [Google Scholar]
- Starkey Laboratories: US patent US 2016/0353214 A1 – method and apparatus for suppressing transient sounds in hearing assistance devices, 2016. [Google Scholar]
- G. Keidser, H. Dillon, M. Flax, T. Ching, S. Brewer: The NAL-NL2 prescription procedure. Audiology Research 1 (2011) 1–6. [Google Scholar]
- F. Denk, T. Hieke, M. Roberz, H. Husstedt: Occlusion and coupling effects with different earmold designs – all a matter of opening the ear canal? International Journal of Audiology 62, 3 (2022) 227–237. https://doi.org/10.1080/14992027.2022.2039966. [Google Scholar]
- Europäische Union der Hörgeräteakustiker e.V. (EUHA): Zusammenfassung EUHA-MPO-Signal und Einstellung der MPO [Summery of EUHA MPO-Signal and setting up the MPO], 2015. [Google Scholar]
- H. Husstedt: Impulse sounds for the evaluation of impulse or transient noise reduction (Version v1.0) [Data set]. Zenodo. 2023. https://doi.org/10.5281/zenodo.8112384. [Google Scholar]
Cite this article as: Husstedt H. Hilgerdenaar W. Frenz M. Denk F. & Tchorz J. 2023. Evaluation of impulse noise reduction in hearing aids with technical measurements and ratings of discomfort. Acta Acustica, 7, 47.
All Tables
Overview about the impulse sounds. The third column contains the C-weighted peak sound pressure levels as recorded and as intended during playback. The forth column lists the sound pressure levels measured in a free field (FF) and measured with the ear simulators of the HATS representing the sound pressure at eardrum (ED).
List of hearing aids used in the study. In the right column, the available settings for INR in the fitting software are listed. The default setting for a hearing loss of type N3 and a flat UCL of 100 dB HL suggested by the fitting software (First Fit) is underlined. For the experiment of this study, the maximum setting was selected indicated with bold letters.
Bonferroni corrected p-values of the one-sample t-test on the differences in C-weighted peak sound pressure level between the state-of-the-art fitting with and without INR for all hearing aids and stimuli.
Bonferroni corrected p-values (for 6 comparisons) of the comparison between the ratings of the hearing-impaired subjects for the setting FIT INR OFF and FIT INR ON with respect to the type of hearing aid using the Wilcoxon signed rank test. The corresponding mean values of the data are depicted in Figure 7b.
All Figures
|
Figure 1 Visualization of the impulse noise signals recorded. A short description of the signals is given in Table 1. All impulse sounds are openly available at https://doi.org/10.5281/zenodo.8112384 [36]. |
| In the text | |
|
Figure 2 Photograph of the technical measurement setup with the HATS (a) and the setup for the ratings of discomfort (b). Moreover, (c) shows the presentation of the rating scale on a touchscreen. |
| In the text | |
|
Figure 3 Results of the pure tone audiometry for the hearing threshold (HT) and uncomfortable loudness level (UCL) of the 24 hearing-impaired (a) and 20 normal-hearing subjects (b). For the hearing-impaired subjects, also the HT of type N3 according to IEC 60118-15 is plotted. The error bars indicate plus/minus one standard deviation. For some measurements with the hearing-impaired subjects, the audiometer limit of 120 dB HL was reached and those values are omitted in the plot of the individual data as well as for the computation of the mean values. Overall, data of two subjects for the HTs and data of five subjects for the UCLs were affected. |
| In the text | |
|
Figure 4 Effect of INR on the C-weighted peak sound pressure level LCpeak at the hearing aid output for a state-of-the-art fitting. For all plots, the average of the repetitions of the left and right ear of the HATS was computed first. Different stimuli are represented by different symbols and different hearing aids by different colors. (a) Scatter plot of LCpeak for the setting FIT INR OFF versus FIT INR ON. (b) Difference of LCpeak between the settings FIT INR OFF and FIT INR ON grouped after the type of hearing aid and (c) the type of stimulus. |
| In the text | |
|
Figure 5 In panel (a), the C-weighted peak sound pressure levels of all impulse signals for the settings FTS+CR, FTS+OL, FTS+NRSE, and FTS+INR relative to the values of setting FTS (∆LCpeak) are plotted (for the measurements without speech). In panel (b), the C-weighted sound pressure levels (no peak) during the 7 s long speech signal before the impulse signals for the settings FTS+CR, FTS+OL, FTS+NRSE, and FTS+INR relative to the values of setting FTS (∆LC) are plotted for the signal keychain dropped (for the measurements with speech). In both panels the data of HA2 for the settings FTS+CR and FTS+OL were excluded, because CR was coupled with the settings of the OL so that the individual programming of each feature in the fitting software was not possible. For both plots, the average across repetitions and ears of the HATS are considered. |
| In the text | |
|
Figure 6 Ratings of discomfort not uncomfortable (not u.) to extremely uncomfortable (ext. u.) of the normal-hearing (NH) and hearing-impaired (HI) subjects for all nine stimuli as listed in Table 1. For the hearing-impaired subjects, the first condition is without hearing aids (HI), the second (HI, INR OFF) and third condition (HI, INR ON) with hearing aids programmed with the settings FIT INR OFF and FIT INR OFF, respectively. For the conditions with hearing aids, the results of all six types of hearing aids were averaged. |
| In the text | |
|
Figure 7 Ratings of discomfort averaged across hearing-impaired subjects with hearing aids for the settings FIT INR OFF and FIT INR ON visualized as a scatter plot (a) or grouped after the type of hearing aid (b) or the type of stimulus (c). In (b) and (c), the left values correspond to the setting FIT INR OFF and the right values to the setting FIT INR ON. |
| In the text | |
|
Figure 8 Scatter plot of the C-weighted peak sound pressure levels measured at the ear simulators of the HATS against the mean ratings of discomfort. The type of symbol indicates the type of stimulus. Black symbols correspond to the normal hearing test subjects (NH), and the values of the hearing impaired subjects are color coded depending on the type of hearing aid. Moreover, the settings of the hearing aids FIT INR OFF and FIT INR ON are marked with a horizontal (“–”) and vertical (“|”) black line, respectively. |
| In the text | |
Current usage metrics show cumulative count of Article Views (full-text article views including HTML views, PDF and ePub downloads, according to the available data) and Abstracts Views on Vision4Press platform.
Data correspond to usage on the plateform after 2015. The current usage metrics is available 48-96 hours after online publication and is updated daily on week days.
Initial download of the metrics may take a while.