| Issue |
Acta Acust.
Volume 8, 2024
|
|
|---|---|---|
| Article Number | 24 | |
| Number of page(s) | 11 | |
| Section | Room Acoustics | |
| DOI | https://doi.org/10.1051/aacus/2024018 | |
| Published online | 12 July 2024 | |
Supplementary material
This article provides supplementary material (photos and 2D graphics) for the visualization of the six test rooms showing the sizes and positions of sound-absorbing surfaces.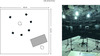 |
Figure S1: 2D graphic and photo of the experimental setup in the anechoic room in Lübeck (LB anechoic). |
 |
Figure S2: 2D graphic and photo of the experimental setup in an audiometric test room in Lübeck (LB room 1). |
 |
Figure S3: 2D graphic and photo of the experimental setup in an audiometric test room in Lübeck (LB room 2). |
|
Figure S4: 2D graphic and photo of the experimental setup in the anechoic room in Oldenburg (OL anechoic). |
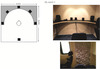 |
Figure S5: 2D graphic and photo of the experimental setup in an audiometric test room in Oldenburg (OL room 1). |
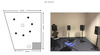 |
Figure S6: 2D graphic and photo of the experimental setup in an audiometric test room in Oldenburg (OL room 2). |
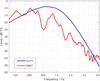 |
Figure S7: Third-octave spectra for CCITT noise (blue) and Freiburg monosyllabic speech test (FMST) (red). |
© The Author(s), Published by EDP Sciences, 2024
Current usage metrics show cumulative count of Article Views (full-text article views including HTML views, PDF and ePub downloads, according to the available data) and Abstracts Views on Vision4Press platform.
Data correspond to usage on the plateform after 2015. The current usage metrics is available 48-96 hours after online publication and is updated daily on week days.
Initial download of the metrics may take a while.