| Issue |
Acta Acust.
Volume 9, 2025
|
|
|---|---|---|
| Article Number | 44 | |
| Number of page(s) | 22 | |
| Section | Environmental Noise | |
| DOI | https://doi.org/10.1051/aacus/2025027 | |
| Published online | 17 July 2025 | |
Technical & Applied Article
Sound model of an acoustic improved air to water heat pump
1
Viessmann Holding International GmbH Viessmannstraße 1 35107 Allendorf(Eder) Germany
2
Institute for Energy Efficient Buildings and Indoor Climate, RWTH Aachen University 52074 Aachen Germany
* Corresponding author: This email address is being protected from spambots. You need JavaScript enabled to view it.
Received:
21
February
2025
Accepted:
17
June
2025
Abstract
Heat pumps represent an essential component of the energy transition. While they are effective in generating heat, they also generate sound, which has the potential to cause annoyance. Therefore, it is essential to enhance the transparency of the sound behavior. Analyses were performed to identify the factors that influence sound levels at the component and system levels. A total of three refrigerant compressors were examined with the objective of determining the most acoustically efficient components currently available and the key factors influencing acoustics. Two low-noise axial fans are used to illustrate the differing sound characteristics when used in a heat pump application. Based on component tests and measurements at the heat pump system level, the speeds of the compressor and fan were confirmed as significant factors influencing the sound emissions of air-to-water heat pumps. In addition, the flow temperature and the operating point of the fan were identified as factors influencing. The results were employed to develop an acoustically improved heat pump demonstrator, which was based on a representative design. A sound model could be developed that is capable of describing the sound behavior for a wide range of operating conditions. This methodology allows for increased transparency in sound behavior. Different sound behaviors of heat pumps can be demonstrated on the basis of the model, and discussions on the definition of maximum sound specifications can be held on the basis of data. Sound emissions should not only be linked to heat output, as this increases the uncertainty of comparability. A transparent representation of the speeds is strongly recommended.
Key words: Heat pump noise / Sound model / Acoustics / Refrigerant compressor / Psychoacoustics
© The Author(s), Published by EDP Sciences, 2025
 This is an Open Access article distributed under the terms of the Creative Commons Attribution License (https://creativecommons.org/licenses/by/4.0), which permits unrestricted use, distribution, and reproduction in any medium, provided the original work is properly cited.
Nomenclature
AWHP: Air to water heat pump
VFD: Variable frequency drives
RSME: Root mean square error
EBC: Institute for Energy Efficient Buildings and Indoor Climate
IHTA: Institute for Hearing Technology and Acoustics
A7W55: Air 7 °C, Water 55 °C, Heat pump operating condition
T Air: Air temperature
T VL: Water flow temperature
Q h : Heating capacity
T design,h: Design temperature for heating application
P design,h: Heating load
P rated: Rated heat output
n comp: Compressor rotation speed
n fan: Fan rotation speed
L W,ErP: Noise rating for energy-related-products
TOL: Total operating limit
Biv: Bivalence point
L W,Max: Maximum sound power level
T e : Evaporation temperature
T c : Condensation temperature
p e : Evaporation pressure
p c : Condensation pressure
ψ: Pressure ratio
dT: Suction gas superheat
σ: Standard deviation
L W,comp: Contribution compressor sound power level
L W,fan: Contribution fan sound power level
L W,HP: Heat pump sound power level
q v : Air volume flow
q v,design: Design air volume flow
Δptt: Total pressure difference
L p,GG: Background noise level
1 Introduction
Heat pumps represent a pivotal solution for the energy transition. To date, nearly 80% of all heat pumps installed in Germany have been air-to-water heat pumps (AWHP) [1], which utilise ambient air as a heat source and facilitate its availability to a water circuit. In addition to a compressor, this design requires one or more fans, which are significant sources of noise. Möhler and Eulitz [2] posit that noise pollution from stationary sources, such as AWHPs, will increase significantly in the coming years. Modern heat pumps are equipped with power modulation, whereby the speeds of the compressor and fan(s) adapt to the operating status. The fluctuations in sound emissions resulting from changes in the external temperature and the required heating output cannot be adequately represented by the current legislative framework governing noise labelling. The results presented here include excerpts of those originally presented at DAGA 2024 in Hanover [3].
The mandatory sound rating for energy-related-products LW,ErP of variable output AWHP is defined by the Ecodesign Directive with Regulation (EU) No. 813/2013 [4] and described in DIN EN 12102-1 [5]. If an average climate profile [6] is taken as a basis, the standard rating condition for sound measurement is an air temperature Tair=7 °C and a water flow temperature TVL=55 °C with a spread of 8 K, which can be expressed as A7W55. The sound power measurement is conducted with the device settings configured to achieve the performance specifications outlined by the manufacturer in accordance with the requirements of DIN EN 14825 [7].
Figure 1 illustrates the operating behavior based on the heat pump demonstrator. In this instance, the reference design temperature for heating application Tdesign,h is assumed to be −10 °C, with a heating load Pdesign,h of 10 kW. The heating load and variable heating outputs are presented as nominated to the design point. The partial load ratios (A–D) vary according to the external temperature, as defined in DIN EN 14825 (red line). Furthermore, the bandwidth of the calculated heat output based on DIN EN 14511-3 [8] of the heat pump demonstrator for standard rating conditions according to DIN EN 14511-2 [8] is plotted on a grey background. The operating hours distribution demonstrates that periods of very low outdoor temperatures, up to the total operating limit (TOL), represent a minor proportion of the total operating time. The bivalence point (Biv) defines the outdoor temperature up to which the heat pump can provide the heating output in monovalent mode. In this case at −7 °C.
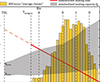 |
Figure 1. Rating points and BIN hours distribution according to DIN 14825 [7] and operating conditions for sound labeling according to Ecodesign Directive with additional information of the minimum and maximum heating capacity Qh of the demonstrator heat pump. |
Sound labeling is carried out for evaluation point C. The partial load condition at the corresponding outdoor temperature of 7 °C must be at least 35%. Compared to the modulation range of the AWHP, the sound can be determined at a very low partial load condition. For the sake of completeness it should be mentioned that in the past the label could also be specified for higher capacities. This means that it is not possible to compare the sound data of different models offered in a comparable performance class on the basis of the current labeling regulations without further consideration.
In addition to the sound labeling required by law, databases and manufacturers’ documentation provide further sound data for reduced sound power levels at night time operating modes and maximum sound data LW,Max. There is no common definition for determining these specifications. This may result in disparate interpretations of the conditions. In some cases, a representative loudest condition is suggested by specifying the maximum sound power level. Oltersdorf [9] demonstrates that a considerable number of specifications are implausible due to the fact that the difference between LW,Max and LW,ErP is either zero or negative. Figure 2 illustrates the findings of a study conducted by Stiftung Warentest [10], in which a range of AWHPs were evaluated based on their sound behavior, among other criteria. This is compared with the sound data from the database of the German Heat Pump Association [11]. There is no evident correlation between an acoustic rating of “good +” and the specified sound power levels. It is evident that factors such as spectral composition and tonal content are also significant, in addition to the numerical values. Consequently, it is not possible to ascertain from the published sound levels whether a system is acoustically “good +” or “average o”. Furthermore, the research presented in the paper “Acoustic Noise Measurement of Air Source Heat Pumps” provides evidence of a misalignment between the sound values provided by the manufacturer and those measured in situ [12]. It could therefore be assumed that there is a lack of transparency in the declared sound power levels of inverter-controlled air-to-water heat pumps.
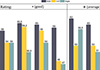 |
Figure 2. Results of a Stiftung Warentest study [10] in comparison with the sound data in the BWP database [11]. |
In this paper, the sound behavior will not only be shown at a few operating points. The holistic sound behavior will be covered by a sound model. An acoustically improved air-to-water heat pump demonstrator will be used to investigate the main factors influencing the sound behavior under different ambient conditions.
The current state of knowledge on the sound behavior of air-to-water heat pumps is summarized by Torjussen et al. [13] and Langerova [14].
A seasonal sound power level has been introduced as part of Annex 51 [15]. Based on the sound power levels at the rating points according to DIN EN 14825, an energetic mean level is derived, taking into account the hourly distribution [16, 17]. Approaches to coupling acoustic behavior to energetic models are described by Vering et al. [18] and Klingebiel et al. [19]. The sound model presented in this paper represents a further improvement of the seasonal sound power method. This approach enables to predict most operating conditions acoustically instead of using seven discrete sound power levels. Instead of distribution functions on an hourly basis, distribution functions with a smaller time-step size can be used due to the better data set. These distribution functions can be calculated using energy system simulations, for example [20]. The feasibility of formulating a comprehensive description of the acoustic behavior enables the refinement of the time-step size in system simulations, thereby aligning the temporal resolution with the actual perception.
2 Methods
Complex systems, such as an air-to-water heat pump, are defined by a multitude of influencing factors. In order to account for the full range of influencing factors, tests on air-to-water heat pumps are typically conducted in climatic chambers. All operational conditions that may be encountered in situ can be replicated in the chamber. However, conventional climatic chambers are not an appropriate means of reliably determining the sound behavior of air-to-water heat pumps with low acoustic measurement uncertainty and identifying significant acoustic influencing factors. The climate chamber environment is strongly characterized by a locally fluctuating sound pressure level distribution due to the size and typical design of the chamber with sound-reflecting surfaces. This leads to greater measurement uncertainties. In the case of sound sources with low emission levels, as is the case with the acoustically optimized heat pump demonstrator, the high background noise levels caused by the system technology of the climatic chambers prevent the necessary signal-to-noise ratio from being achieved. This also has the effect of reducing the accuracy of the measurements. Furthermore, conventional acoustic test benches are typically inadequate for replicating the full range of operational scenarios for air-to-water heat pumps. To ascertain significant acoustic influencing factors, precision measurements with high accuracy are required.
Consequently, the studies were conducted in multiple phases, with each level examined individually. Figure 3 illustrates the sequence of measurements conducted. In the initial phase of the investigation, an examination was conducted at the component level. An hemi-anechoic chamber was used to examine a range of refrigerant compressors, covering various designs and manufacturers. These were tested on a component test bench. In addition, investigations were conducted in collaboration with the company ebm-papst Mulfingen GmbH & Co. KG with the objective of identifying the acoustically optimal fan and characterizing the behavior of the Aero system. A variety of axial fans were subjected to both simulation-based and experimental enhancement within a model of the demonstrator. On the basis of the preliminary component investigations, the components with the optimal acoustic properties were identified and subsequently installed in the demonstrator. This demonstrator is used to investigate the acoustic behavior of the system. Based on the results of the component investigations and the heat pump system investigations, a noise model is derived to predict the noise behavior under deviating operating conditions. This model is linked to the performance data of the heat pump developed. As part of the project, the EBC and IHTA Institutes of RWTH Aachen University are investigating a reference heat pump of the same performance class as the acoustically optimized demonstrator. In the course of this, additional listening tests are carried out using noise stimuli from the reference heat pump and the demonstrator.
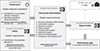 |
Figure 3. Methodical procedure for determining the relevant acoustic parameters influencing the heat pump sound of the developed demonstrator. |
3 Describtion of demonstrator heat pump
The air-to-water heat pump demonstrator is initially based on a Viessmann Vitocal outdoor unit type AWO-M-E-AC 251.A10 (Fig. 4b) with a rated heat output Prated=10 kW at a low temperature application W35. This heat pump won the Stiftung Warentest comparison [10] and has already been rated as acoustically good.
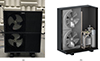 |
Figure 4. View and section cut view of the demonstrator heat pump. (a) Heat pump demonstrator used for the sound model. (b) Principle sketch of the initial heat pump with two fans on the left-hand side of the appliance and a view of the machine room on the right-hand side. |
On the basis of the preliminary component investigations, the components with the optimal acoustic properties were identified and subsequently installed in the demonstrator. The dimensions of the standard appliance, the design of the appliance and the future-proof R290 [21] refrigerant used have remained unchanged. The refrigerant circuit configuration has remained unmodified. The demonstrator is characterized by the following dimensions: an overall length of 600 millimeters, an overall width of 1144 millimeters, and an overall height of 1382 millimeters (Fig. 4a).
4 Component studies
This section sets forth the methodology to be employed in the component tests. The objective of this study is twofold: firstly, to identify the optimal components from an acoustical perspective, and secondly, to identify the acoustically relevant influencing factors. The focus is on the two main noise-generating components, namely the compressor and the fan. The compressor is studied separately from the heat pump. However, the component investigations of various fans are carried out taking the heat pump design into account. It is anticipated that interactions with the heat exchanger, the installation position and the pressure-side design grill will be observed in this context [22].
4.1 Compressors
The compressors are responsible for compressing the refrigerant from the low-pressure side to the high-pressure side through the application of technical work. As a main component of an AWHP, the compressor requires significant investment in the development of an AWHP. It has a significant impact on efficiency and also on acoustics.
4.1.1 Research method
The factors influencing the noise of refrigerant compressors were determined experimentally. Sound power measurements were carried out at component level in a hemi anechoic chamber. To determine the acoustic signature of various refrigerant compressors, a compressor test bench based on DIN EN 13771-1:2017 [23] was used. Analogous to the procedure for determining the thermodynamic parameters. In contrast to the performance measurements, the compressor is placed in an acoustic measurement environment and the compressor test bench in an adjacent room (Fig. 5). The refrigerant compressors can be described by a black box model [24]. In the investigations, the parameters evaporation temperature Te (analogous to evaporation pressure pe), condensation temperature Tc (analogous to condensation pressure pc), suction gas superheat dT and compressor speed ncomp were systematically varied and the influence on the emitted sound power level was measured. In addition to the changes to the overall sound power level, spectral analyses (one-third octave bandwidth) and narrowband analyses of the compressor noise were carried out. In a first step, the significance of the influencing parameters on the total sound power level and the analysis parameters derived from them were investigated. Subsequently, the absolute levels of the investigated compressors were compared with each other and their acoustic signatures were analyzed and evaluated.
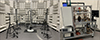 |
Figure 5. Test setup in a hemi-anechoic chamber and the compressor test bench in an adjacent room. |
4.1.2 Measurement environment and operating mode
The emitted sound power of the compressors was determined using a free-field measurement method on a reflective plane in accordance with ISO 3745 [25] and a measurement distance r=2 m, utilizing 20 1/2″ free-field microphones type G.R.A.S. 46AE. The acoustic measurement system was calibrated before and after the measurements and in addition verified with a reference sound source when the test setup was first setup. The installation complies with the recommendations of AHRI Standard 530-2022 [26] on an impedance mass. A mass ratio >4 is required there; a blocking mass of 314 kg was used. This ensures a mass ratio ≫10. The compressors were tested with the elastic rubber mounts recommended by the manufacturer with different geometries, depending on the test specimen. The discharge and suction gas pipes were made with flexible GOMAX Infinity hoses. The compressors are operated at a stationary operating point. The measurement is taken after approx. 10–15 min of steady state. The influencing factors compressor speed ncomp, evaporation temperature Te, condensation temperature Tc and suction gas superheat dT at the compressor inlet were kept constant for discrete measurements. The measurement duration for the stationary acoustic values were 30 s with a sampling rate of 51.200 Hz. Thermodynamic parameters are measured with a sampling rate of 1 Hz. The following measurement campaigns were examined:
-
Variation of the compressor speed under constant operating conditions.
-
Variation of operating conditions at constant speeds.
The parameters were varied individually (one factor at a time) within the operating envelopes of the respective compressors. In addition, transient run-ups and run-downs were measured.
4.1.3 Selection of compressors
The refrigerant compressors to be investigated are selected on the basis of the performance class of the heat pump demonstrator under investigation in the range of approx. 8–13 kW nominal output and the refrigerant R290 used. Typical designs in this application range are scroll and rotary piston compressors [27]. A market research was carried out to compare common compressors and the in Table 1 listed three test specimens were determined.
Selected refrigerant compressors for acoustic comparison.
The selection process ensures that different designs and manufacturers are considered for comparable stroke volumes.
4.1.4 Results
Sound power levels of up to 90 dB(A) were determined for the compressors tested. The minimum sound power level determined for the quietest compressor tested at minimum speed is still above 50 dB(A). As a result, at the component level the refrigerant compressor is the component with the highest sound emission compared to the determined fans. Figure 6 illustrates the characteristic of the sound power levels based on transient run-down measurements with stationary, controlled starting conditions. The run-down duration is set to ten minutes to ensure a stable measurement of resonant peaks. In addition to the total sound power, band-pass-filtered levels are shown, divided into low-frequency (b), medium-frequency (c) and high-frequency (d) components. The subdivisions were chosen to make the determined structural resonances of different compressors visible. It can be observed that compressor B emits the lowest levels across all states. The noise behavior of the other two compressors is strongly characterized by resonant effects, which are particularly noticeable with compressor A in the low-frequency range. A narrow-band resonant increase in the sum level is observed in the lower speed range for Compressor C. If this behavior is also transmitted by the heat pump design, it can be expected that an annoyance will result in this state.
 |
Figure 6. Comparison of the sound power level (class 2 σ=1.5 dB [28]) of different refrigerant compressors. (a) Overall value 20 Hz to 10 kHz. (b) Bandpass filter 20 Hz to 400 Hz. (c) Bandpass filter 400 Hz to 800 Hz. (d) Bandpass filter 400 Hz to 3 kHz. |
Moreover, the impact of internal operating envelope constraints on the upper speed limit was discerned for compressor C. In the operational range examined, it was not feasible to reach a maximum speed of 6600 rpm at elevated condensing temperatures. As illustrated in Figure 6b, the low-frequency acoustic maximum can be achieved at the highest possible speed with a reduced condensation temperature, or alternatively at a reduced speed with a high condensation temperature.
The results of the parameter study of three refrigerant compressors are depicted in Figure 7. A total of 288 stationary measurements were evaluated. The range of the minimum and maximum sound power levels determined is plotted against the influencing factors. For each compressor, rotational speed is the most significant influence, with a range of up to almost 30 dB. There is no significant influence of suction gas superheating. The pressure ratio ψ for the test stand used can be described in a good approximation by the ratio of the condensation pressure pc to the evaporation pressure pe. The pressure ratio leads to a variation of up to 4 dB in the determined sound power.
 |
Figure 7. Factors influencing the sound power level (class 1 σ=0.5 dB [25]) of three different refrigerant compressors, based on measurements (n=288) taken under stationary operating conditions with test method one factor at a time. |
In Table 2 the single standard deviation calculated as a function of compressors and influences is shown.
Standard deviation of measurement data (n=288) on compressor tests taken under stationary operating conditions.
4.1.5 Conclusion for sound model
An analysis of the measurement data reveals that compressor noise is predominantly influenced by resonant effects. Consequently, a regression model that provides a rudimentary explanation of compressor noise is inadequate. Therefore, stationary measuring points with a tight speed resolution are used under controlled operating conditions at system level heat pump.
The main factor influencing compressor noise is the rotational speed ncomp. Overheating is assumed to be insignificant. A lower influence of the pressure ratio is recognizable. The emitted sound power level of a refrigerant compressor can be described under consideration of the influences speed ncomp and pressure ratio ψ.
 (1)
(1)
In a system-level heat pump, this can be taken into account by varying the water flow temperature TVL at a constant air temperature Tair. It is advisable to use the standard operating conditions according to DIN 14511-3 at an air temperature of 7 °C. This leads to an evaporation temperature in the middle of the operating envelope without icing problems of the evaporator and the risk of condensation in the acoustic test environment.
4.2 Fans
When used in heat pumps, fans generate forced convection at the air/heat exchanger (evaporator). The selection is based on the total pressure increase Δptt for a desired volume flow qv,design [29]. Axial fans are typically used in the design and performance class examined. This section describes the fan noise tests.
4.2.1 Research method
Measurements on a combined air-performance-sound test bench in accordance with DIN EN 13347-3 [30] were carried out at company ebm-papst Mulfingen GmbH & Co. KG with an accuracy class 2 (σ=1.5 dB [28]) as shown in Figure 8 and additional measurements in a hemi-anechoic chamber with an accuracy class 1 (σ=0.5 dB [25]) at company Viessmann Climate Solutions SE as shown in Figure 9. Using the demonstrator as an example, market available axial fan systems were examined. Fan A is an example of an acoustically optimized low-pressure fan (3 blades), fan B is an example of a pressure-stable fan (5 blades). The dimensions correspond to a size 500.
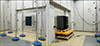 |
Figure 8. Combined acoustic and performance test bench at company ebm-papst Mulfingen GmbH & Co. KG with demonstrator heat pump test sample (left) suction side view (right) pressure side view [31]. |
 |
Figure 9. Acoustic development of the air-to-water heat pump demonstrator in a hemi-anechoic chamber. |
4.2.2 Results
Figure 10a illustrates a comparative analysis of the acoustic behaviour of two distinct axial fans. The solid lines show the fan sound at different speeds when the fan systems are installed in the demonstrator heat pump without additional pressure difference only with the pressure loss of the heat pump. The speeds of the upper and lower fan are the same. The delivered air volume flow qv has been determined in the EBM-Papst test bench. In addition, the dashed lines show the sound power level curve when the pressure difference Δptt is increased, taking into account a constant fan speed. At the design point, fan A is observed to emit a sound power level that is 5 dB lower than that emitted by fan B. An increase in the pressure difference Δptt, for instance as a result of the operation of a heat pump in the presence of icing on the heat exchanger, contamination, or an unfavorable installation situation, will lead to an increase in the sound power level. Fan B, on the other hand, initially shows a slight reduction or constant behavior but on a higher level. From a change in the operating point of Δptt≈16 Pa, the sound level of both systems is at the same level.
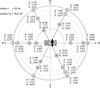 |
Figure 10. Results of the fan comparison. (a) Acoustic behavior of two different fan systems installed in the demonstrator heat pump, diameter correspond to 500 mm. (b) Pressure characteristic curves as sum of two fans, based on measurements installed in the heat pump, curves below the heat pump characteristic curve extrapolated by quadratic function, the design airflow of the heat pump qv,design is 5000 m3/h at a pressure difference of 20 Pa. |
4.2.3 Conclusion for sound model
The sound behavior of both fan systems can generally be described as a function of the fan speed nfan and the pressure difference Δptt.
 (2)
(2)
A logarithmic regression approach according to Madison [32] is used to describe the influence of the fan speed. Taking into account the proportionality laws for geometrically and kinematically similar fan types, a specific sound power level LW,spec,n can be calculated in relation to a reference speed nfan,ref.
 (3)
(3)
With nfan,ref=1/s and α=6.1, the approximation of fan A used in the demonstrator heat pump is:
 (4)
(4)
The RSME is the root mean square error for all differences between the model values and the measured values. The approach leads to RSME=0.59 dB in relation to the speed range used from minimum to maximum speed corresponding to the design volume flow. The RSME in relation to the entire possible speed range is 0.73 dB.
A universally applicable explanation for the impact of the operating point of the fan on the sound power at a constant speed remains unavailable. For this reason, a stepwise linear regression is carried out for the fan used on the basis of the measured values.
 (5)
(5)
5 Acoustic improved heat pump demonstrator
Following preliminary examinations, it was ascertained that the components compressor B and fan A exhibit good acoustic characteristics. Consequently, these were incorporated into the heat pump demonstrator. The subsequent section presents an overview of the tests conducted on this demonstrator.
5.1 Research method
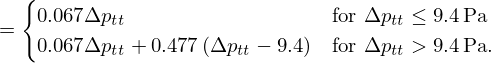
A hemi-anechoic test chamber (volume = 846 m3) was utilised as the measurement environment (Fig. 9), wherein the air temperature was maintained at a constant 7 °C±0.4 K, whereby a background noise level Lp,GG≤7.4 dB(A) in the frequency range from 20 Hz to 20 kHz is complied. The air conditioning supplies an air volume flow of 10 000 m3 h−1 to keep the room temperature constant. The radiated sound power was calculated using a method of accuracy class 1, in accordance with ISO 3745 [25], utilising 20 low-noise microphones type G.R.A.S. 47HC.
The measurement distance was r=3 m as shown in Figure 11, and the standard rating conditions A7W35, A7W55 and A7W65 were maintained in accordance with DIN EN 14511-2 [6].
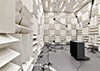 |
Figure 11. Test setup for sound power calculation according to DIN EN ISO 3745, measurement position 14 is used for calculating psychoacoustic parameters. |
The speeds of the compressor and fan were altered in a stepwise manner, allowing the acoustic characteristics to be determined under steady-state operating conditions. Additionally, unsteady run-down measurements were employed as a means of supplementing the data and identifying any potential resonant peaks between the stationary support points. All acoustic parameters were calculated using the software PAK 6.2 Service Release 1 (Müller BBM VAS GmbH, Germany). The investigation include determining the sound power and the contribution of noise components, as well as evaluating the parameters of sound quality. Measuring position 14 is used to calculate these parameters at an angle of 25 ° to the left side in front of the device. The loudness in sone is calculated according to [33]. The tonality in tuHMS is calculated according to ECMA 418-2 [34]. The single-number value is shown on the basis of the MAX hold value for the time period under consideration. A hearing model according to Widmann is used to calculate the sharpness in acum. The parameters of roughness in aspher and fluctuation strength in vacil are calculated for informational purposes only, as a 3 s time section is not sufficient for a reliable calculation. An additional measurement campaign was also carried out to determine the directivity characteristic. The results of the study are presented in the appendix Figure A.5 for informational purposes.
5.2 Acoustic results
The classification of the demonstrator is determined by a comparative analysis of the calculated loudnesses of a reference heat pump [35]. As illustrated in Figure 12, the demonstrator is 3.1 times quieter than the maximum values determined under comparable conditions. The sound power levels are between 10 and 19 dB lower, depending on the specific operating point under consideration. Compared to the initial state heat pump, the maximum sound power level of the demonstrator heat pump is improved by a further 3 dB. The maximum loudness is reduced by factor 1.6.
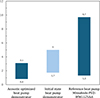 |
Figure 12. Calculated loudness for the same measurement position at free field conditions of the acoustically improved demonstrator compared to the initial heat pump and to a reference heat pump in the same capacity range, data taken from [35]. |
Figure 13 illustrates the acoustic contributions of the compressor and the fans to the overall sound of the heat pump when the compressor speed is varied. For operating condition A7W55, the total sound power level is in the range of 45–55 dB(A).
 |
Figure 13. Contribution of fan and compressor sound power levels to the overall sound power level of the demonstrator at steady state conditions for standard rating condition A7W55 and different compressor speeds from minimum to maximum possible speeds. |
The overall sound of the developed heat pump is mainly determined by the compressor at low and medium capacity range. At higher speeds and correspondingly higher capacities, compressor sound and fan sound are balanced on system level heat pump. The combination of sound contributions only applies to the demonstrator under investigation. The heat pump-specific control method determines whether the fan speed is permanently linked to the compressor speed or alternately controls the fan separately.
The pressure ratio exerting a lesser influence. In this context, the latter is expressed as a variation in flow temperature at a constant source temperature. Figure 14 illustrates the increase in radiated sound power levels for three distinct flow temperatures. It can be observed that with a typical flow temperature condition of W55, the sound maximum is already reached to a reasonable approximation. Higher flow temperatures may restrict the feasible speed range, contingent on the operational envelope of the compressor (cf. Fig. 6, compressor C). This may imply that not all speeds can be achieved.
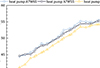 |
Figure 14. Influence of the pressure difference on the sound power level of the heat pump described by a variation of the flow temperature and a constant air temperature. |
As shown in Figure 15 the level-determining frequency components of the fans are in the medium frequency range (fm=315 Hz), while those of the compressor are in the high frequency range (fm=3.15 kHz). The broadband sound components in the frequency range below approx. 1 kHz are attributable to fan noise. The tonal sound components corresponding to the n-order of compressor speed ncomp can be identified as a typical compressor noise signature. In the frequency range above 5 kHz, noise components from the power electronics (VFD noise) are to be expected. However, in this case, they are not significant and therefore are not shown.
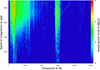 |
Figure 15. Spectrogram of the total sound power level of the heat pump demonstrator from a run-out measurement at A7W55 from maximum to minimum compressor speed. |
If the difference LCeq−LAeq is less than 20 dB, there is no low-frequency noise as defined by DIN 45680:1997 [36]. In the case of the demonstrator heat pump the mean value of the difference between the unweighted sound power level and the A-weighted sound power level LW−LWA is 5.6 dB (cf. Tab. A.1). This demonstrates that the acoustically improved heat pump demonstrator does not emit any significant low-frequency noise components in accordance with the standard in all operating states.
The evidence for the absence of a tonal noise characteristic of the heat pump system is furnished by means of the calculation procedure set forth in ECMA 418-2 [34]. The maximum tonality for all measurement positions and all conditions is determined to be tuHMS<0.36. The mean value of all conditions analyzed is tuHMS=0.1±0.058. Detailed psychoacoustic parameters are shown in Table A.2.
5.3 Conclusion for sound model
The overall emitted sound of an air-to-water heat pump can be described as the sum of all sound contributions (Eq. (6)).
The sound of the demonstrator is essentially made up of the acoustic contributions of the two main components, compressor (LW,comp) and the fan (LW,fan). There are also other potential noise sources (LW,other), such as sounds from the power electronics (VFD-noise) [37], sounds in the refrigerant circuit, boiling sounds at the evaporator, chopping tones or pump noises. However, these are generally only of secondary importance for the demonstrator heat pump. The levels have been determined to be a minimum of 1 dB lower than the contributions from the compressor and fan (cf. Fig. A.4 in the appendix).
 (6)
(6)
For the demonstrator heat pump being considered, the sound components LW,other can be disregarded with a high degree of accuracy. The RSME of the difference between the measured heat pump sound power level LW,HP at condition A7W55 and the sum of the component sound power levels LW,comp+LW,fan(s) is 0.7 dB. The results of the component measurements presented in Section 4.1 can be verified at system level, indicating that the compressor speed ncomp and also the fan speed nfan exerts the most significant influence on the overall system. The pressure ratio ψ can be mapped with sufficient accuracy at the system level of the heat pump if the flow temperature TVL is included.
 (7)
(7)
The values of the compressor sound power as a function of the compressor speed LW,comp(ncomp) are shown in Table A.1. The influence of the flow temperature TVL is estimated on the basis of the average deviation for all investigated compressor speeds per temperature level (cf. Figs. 14 and A.2, A.3 in the appendix). The following assumption is made:
 (8)
(8)
This estimation leads to an RSME of 1.3 dB for the part of the influence of the flow temperature. The mean sound power level of the compressor noise at standard rating condition W35 is −3.9 dB lower than at W55, while at W65 the mean increase is +1.1 dB.
6 Modelling sound behavior
A sound model can be derived from the experimental measurements in order to predict sound behavior under other operating conditions. The workflow is shown in Figure 16. Taking into account the results from the component measurements, a simplification can be carried out with a permissible error margin for the sound model. A reasonable assumption is that the accuracy will be comparable to that of the sound power determination with class 2 according to ISO 3744. This approach is predicated on the assumption that the acoustic input data has been previously determined using a class 1 precision measurement method in accordance with ISO 3745.
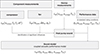 |
Figure 16. Procedure for creating the sound model of the acoustically improved demonstrator. |
Preliminary investigations indicate that the influences of the evaporation temperature Te and the suction gas superheat dT can be neglected to a reasonable approximation. Other influential factors, such as the condensation temperature Tc, which is a reliable estimate of the water flow temperature TVL, and the operating point of the fan (cf. Fig. 10a), can be incorporated into the model using correction factors or a suitable measurement condition. The integration of the results from the fan studies (Eq. (2)) and the results of the demonstrator heat pump leads to the following approach:
 (9)
(9)
This hybrid model of the four most significant factors influencing heat pump sound is developed on the basis of the results presented. It combines two different modeling approaches in order to provide a description of the heat pump system that is as realistic and reliable as possible. Empirical measurement data of the compressor sound power is used with fine discretizations, and required intermediate values are linearly interpolated. This methodology is more appropriate for the analysis of compressor sound for two primary reasons. First, the implementation of stationary measurements in conjunction with controlled thermodynamic operating conditions results in enhanced precision. Second, the phenomenon of compressor noise frequently manifests through resonant processes. Simplified regression models run the risk of smoothing out these resonances. The other influencing factors are mapped using regression models. The approaches are summarized in Table 3.
Approaches for the four most important sound contributions based on the measurement data of the demonstrator.
In the next step, the acoustic behavior of the system is coupled with the performance data. The performance data can be calculated for each speed support point by varying the ambient conditions [38]. In contrast to the normative determination of the performance data, the actual heating performance is used here without time averaging and the boundary condition outdoor unit.
Figure 17 shows the result of the sound model applied to the demonstrator. Based on the measured values at A7, the sound behavior was transferred to other operating conditions. The emitted sound power is represented by color in relation to the air temperature and the heating capacity. The locations of the measuring points are indicated by dots, while the model prediction points are marked by circles. The remaining operating conditions were interpolated. The observed phenomenon by which heat pumps become louder at low ambient temperatures is not a direct consequence of the source or the air temperature. In contrast, the elevated heating demand necessitates the implementation of higher speeds, in particular of the compressor and, therefore, also from the fans in the heat pump. This increase in speed leads to higher sound levels.
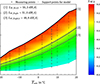 |
Figure 17. Sound model as a function of the heating capacity for a supply temperature of 55 °C and the air temperature based on sound power measurements at standard rating condition A7W55 in a hemi-anechoic room. (1) Line of maximum sound power level of heat pump (2) example line of reduced sound power level with reduced heating capacity at nighttime (3) example line of reduced sound power level with more reduced heating capacity at nighttime. |
Line (1) shows the course of a maximum sound power. In addition, two noise-reduced operating modes were drawn as examples lines (2) & (3), depending on a maximum permissible sound level.
7 Discussion
Coupling the acoustic behavior with the heat output enables effective visualization of the system behavior. However, this coupling leads to increased uncertainty when the focus is on sound comparison or market observation of different heat pump systems. The considerable differences in performance that can be observed across different system boundaries and evaluation periods make meaningful comparisons even more difficult. Furthermore, numerous thermodynamic and hydraulic parameters influence the heating power output. The possibility of modifying the parameters during the sound power measurement is even considered in Appendix A of DIN 12102-1 [5]. In this study, it was demonstrated that the sound is largely determined by the rotational speed of compressor and fan(s) and to a lesser extent by the pressure difference of the compressor. The operating point of the fan has the ability to exert an influence, as well. Consequently, a transparent presentation of the speeds is strongly recommended for sound measurements of heat pumps.
The specification of maximum sound power levels is not always interpreted consistently. A maximum sound power level of 69 dB(A) was determined for the reference heat pump compared in this report [35]. However, the manufacturer's specification is only 62 dB(A) [11].
In regard to the acoustic characteristics of heat pumps, it can be stated that the acoustic maximum occurs most frequently at the maximum operating speeds. In certain instances, however, the compressor speed may be constrained by internal envelope boundaries at elevated flow temperatures (cf. behavior of compressor C in Fig. 6). In this case, it can be stated that the acoustic maximum is either at the highest compressor speed limit with a low flow temperature or at the highest achievable speed with a high flow temperature. The internal compressor operating maps, which vary depending on the manufacturer and design, have a significant influence. This is particularly relevant if compressor noise accounts for a significant proportion of overall noise. In addition, resonant amplification can generate a noise maximum in the medium speed range with sub-optimal heat pump designs. These can be identified by transient measurements. However, it is recommended to perform sound power measurements in stationary operating conditions with fixed compressor and fan speeds. Due to the high accuracy and reproducibility guaranteed by controlled thermodynamic operating conditions, this is the optimum procedure. In order to identify resonant effects of the device design or the components used, transient measurements could also be carried out. Run-downs are preferable to run-ups, as a high steady-state condensation pressure can be used as the starting conditions.
The application of the aforementioned sound model permits the visualization of the disparate control behaviors exhibited by air/water heat pumps. The behavior illustrated in Figure 18 can be discerned by examining performance diagrams [39] and analyzing noise measurements on heat pumps (cf. the reference heat pump behavior shown in Tab. 1 in [35]). Should the air temperature exceed a specified threshold value, the maximum speeds of the fan or/and compressor are effectively blocked, thereby preventing their activation. Consequently, the maximum sound power cannot be achieved within this temperature range. Normative sound measurements are performed within this temperature range, which can result in an inaccurate representation of the maximum sound power under the typical temperature condition of 7 °C, despite setting a presumed maximum heating power (cf. point (a) in Fig. 18). This leads to the assumption that the sound power is influenced by the source/air temperature, which is not accurate.
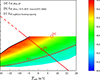 |
Figure 18. Examples of different interpretations of maximum sound power levels. Point (a) represents a maximum sound power level at an air temperature of 7 °C with reduced rotational speeds of fan and compressor when the heating capacity is limited for higher air temperatures, Point (b) is an example when the maximum sound power level is declared for cummulated bin hours >75% for an average climate [7] and line (c) shows a reduced maximum sound powel with very low heating capacity. |
An alternative methodology for interpreting the maximum sound power is to consider it as a percentile value. The utilization of assessment point b in Figure 18 (for further reference, cf. Fig. 1, assessment point B) is predicated on the assumption that the sound in question will not be exceeded in more than 75% of the operating hours, based on the distribution of operating hours. However, this description is also erroneous, as the periods of domestic hot water preparation are not taken into account. Furthermore, even short periods with higher speeds lead to a notable increase in the average sound level.
The author posits that a maximum sound power corresponds to a maximum possible equivalent average sound level that is not exceeded during normal operation. If an operating condition arises that allows a maximum sound power for a few minutes, this must also be indicated. In order to comply with the relevant legislation, it is necessary to take into account the operating hours at low outside temperatures and domestic hot water preparation. Consequently, the labeling of MAX sound power level according to Figure 17 is required.
With regard to technical devices, it is common practice to activate noise-reduced operating modes for periods of increased sensitivity, such as at night. This is typically done by limiting the maximum output in the control system. This procedure is also used for air-to-water heat pumps with variable capacity. In order to facilitate meaningful comparisons between different solutions, it is essential to consider the available capacity. In noise-reduced operation, the machine must maintain a minimum capacity without a concomitant loss of efficiency. The reduction of the air mass flow and, consequently, the fan noise to a minimum inevitably results in a loss of efficiency.
It is also advisable to avoid the use of an operating mode that attains a maximum sound power level in noise-reduced operation, but which does so at the cost of significant performance and/or efficiency losses (cf. line (c) in Fig. 18). It is recommended that the products exhibit the characteristics depicted in Figure 17. It is advisable that the heat pump should always exhibit a heating capacity of at least 50% of the declared capacity in noise-reduced operation. Given the satisfactory approximation of the linear relationship between heating capacity and compressor speed, the speed ratio between the maximum achievable speed and the speed in noise-reduced operation can be regarded as a reliable indicator.
In summary, the following influences can lead to a different interpretation of the maximum sound power:
-
Limitation of the speeds of the compressor and fan(s) in partial ranges of the outdoor temperature.
-
Use of a partial load condition for specification.
-
Over-reduction of the heating output at night.
-
Reduction of the fan speed to reduce the contribution of a noise source to the disadvantage of efficiency, with short-term continuation of the heating capacity under test bench conditions.
It is also important to consider transient states such as defrosting, switching on, and reverse operation when evaluating noise-reduced operation. The average sound power level LW,Aeq for the defrosting time should not exceed the declared value. Short-term noise peaks, for instance, those caused by switching operations, should not exceed this value by more than 20 dB. These requirements ensure that the limit values in accordance with TA Lärm [40] can be readily met.
8 Conclusion
The results of the compressor measurements demonstrate that the noise behavior of refrigerant compressors within the same capacity class exhibits notable differences in both amplitude and frequency composition. The sound characteristics are largely a function of the design. The total sound power level is notably influenced by the speed and, to a lesser extent, by the pressure ratio.
The investigation of the fans was conducted in conjunction with the heat pump design. This allowed for the identification of the optimal fan system from an acoustic perspective. An acoustic model for the fan sound was developed based on the empirical data.
The identification of the optimal acoustic components enabled the development of an improved heat pump demonstrator. With regard to the psychoacoustic parameter of loudness, the heat pump demonstrator is 3.1 times quieter than an analyzed reference heat pump in the same performance class. A sound model was derived from the demonstrator, which describes the acoustic behavior not only in selected operating states, but for a large range of operating conditions. This enables conclusions to be drawn about the overall behavior based on sound measurements at standard nominal conditions and air temperature of 7 °C.
Furthermore, the developed data set provides the potential for the visualization of acoustic effects and the conduct of a data-based discussion. In particular, it permits the definition and interpretation of maximum sound power levels.
The investigation demonstrated that the fan and compressor speeds exert the most significant influence on the sound behavior of air-to-water heat pumps. In contrast, the pressure difference in the refrigerant circuit plays a relatively minor role. However, at the device level, this influence can be accounted for by incorporating the flow temperature.
To enhance transparency, it is recommended that information on the speeds of the compressor and fan(s) be provided for sound performance tests. This could be particularly relevant in the context of partial load conditions, as these can be compared with the maximum speeds for all conditions. This approach allows for an understanding of the relationship between the measured sound power level and the maximum sound power level.
9 Outlook
A reliable description of the acoustic emission across all operating conditions, taking into account building heating load profiles, enables the prediction of sound distribution over defined periods of time. In addition, the effect of improving the energy efficiency of the building envelope on the sound emission of the heat pump demonstrator can be calculated directly using the sound model. The accuracy of sound immission forecasts to avoid low-frequency noise conflicts can be increased thanks to the improved acoustic input data. Coupling the sound model to energy-related building simulations with a low time resolution enables acoustically optimized heat pump control behavior.
Funding
The authors would like to thank the Federal Ministry for Economic Affairs and Climate Action (BMWK) and the Project Management Jülich (PtJ) for their support of the “lowNoise” project (grant no. 03EN4020/B) [41].
Conflicts of interest
The authors declare no conflict of interest.
Data availability statement
The research data associated with this article are included in the article.
Appendix A
Table A.1 shows the measured values of the compressor sound power contribution under controlled operating conditions. Table A.2 shows the calculated psychoacoustic parameters of the demonstrator heat pump. The assumption of the regression equation for the consideration of the operating point for the fan sound is shown in Figure A.1. The deviation of the compressor sound power for a variation of the compressor speed and the flow temperature is shown in Figure A.2. Figure A.3 shows the assumption for the regression model of the influence of the outlet temperature on the sound level of the heat pump compressor. Figure A.4 represents the Figure 15 with an extended frequency range. Figure A.5 shows the test setup and the results of a directivity test based on the demonstrator heat pump.
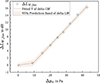 |
Figure A.1. Approximation of the influence of the fan operation on the sound power level for variation of the pressure drop on the basis of the results of fan A. |
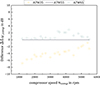 |
Figure A.2. Influence on compressor sound power level at system level in the heat pump demonstrator for N=21 different compressor speeds at standard rating conditions A7W35, A7W55 and A7W65. |
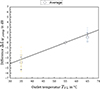 |
Figure A.3. Approximation of the influence on compressor sound power for different outlet temperatures based on the average deviation of the A-weighted measurements. |
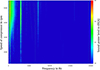 |
Figure A.4. Spectrogram of the total sound power level of the heat pump demonstrator from a run-out measurement at A7W55 from maximum to minimum compressor speed with extended frequency range. The main noise components are in the frequency range below 5 kHz. the components at 3 kHz and 7.2 kHz can be assigned to the compressor noise mainly exhaust by pressure pulsation. The VFD sounds have a minor contribution in this case, the carrier frequency of compressor drive is 6 kHz, the expanding sidebands correspondent to the switching frequencies, the VFD sound of fan motor is at 16 kHz. |
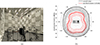 |
Figure A.5. Results of a directivity analysis for a heat pump demonstrator with low noise emission, the directivity of the sum level dominates towards the rear and front. The difference is approx. 5 dB to the sides. The directivity of the level-determining component of the 3.15 kHz one third octave band is more complex with a maximum in the left-rear direction (angle of approx. −150°). (a) Test setup for directivity analysis with 24 additional microphones on a circular measuring surface (cf. Fig. 11) and an angular distance of 15°. (b) Directivity characteristic of the overall sound power level and the level-determining one third octave band 3.15 kHz on the basis of a run out measurement at condition A7W55, 1 s time blocks from maximum to minimum heating capacity. The arrow describes the direction of the air flow, the compressor symbol the position of the machine room with the refrigerant circuit. |
Sound power levels of compressor noise LW,comp using the example of the demonstrator heat pump at standard rating condition A7W55. The overall sound power level is calculated from 50 Hz to 16 kHz.
Calculated psychoacoustic characteristic values for 32 time sections with a duration of 3 s based on a run-out measurement over a period of 10 min under controlled operating condition A7W55. The calculations are based on the recorded sound pressure levels Leq at measurement position 14, Qh is the part load heating capacity at A7W55 in %, nc is the speed of the compressor in rpm, LWA is the sound power level of the heat pump demonstrator in dB(A), N is the loudness in sone, S is the sharpness in acum, T is the tonality in tuHMS, R is the roughness in asper, and F is the fluctuation strength in vacil.
References
- Bundesverband Wärmepumpe (BWP) e.V.: Sales statistics for heating heat pumps in Germany 2017 to 2023, 2024, https://www.waermepumpe.de/presse/zahlen-daten/, last accessed on 27.01.2025. [Google Scholar]
- U. Möhler, C. Eulitz: Leitfaden – Tieffrequente Geräusche im Wohnumfeld. Umweltbundesamt, 2017 [Google Scholar]
- T. Schmidt, D. Müller: Vermeidung der akustischen Lästigkeit von Luft-Wasser-Wärmepumpen, in: Deutsche Gesellschaft für Akustik e.V. (Hrsg.), Fortschritte der Akustik, DAGA 2024: 50. Jahrestagung für Akustik (2024), pp. 774–777 [Google Scholar]
- European Commission: Ecodesign Directive (EU) No. 813, 2013 [Google Scholar]
- DIN EN 12102-1:2023-11: Air conditioners, liquid chilling packages, heat pumps, process chillers and dehumidifiers with electrically driven compressors – Determination of the sound power level – Part 1: Air conditioners, liquid chilling packages, heat pumps for space heating and cooling, dehumidifiers and process chillers; German version EN 12102-1:2022. [Google Scholar]
- DIN EN 14511-2:2023-08: Air conditioners, liquid chilling packages and heat pumps for space heating and cooling and process chillers, with electrically driven compressors – Part 2: Test conditions; German version EN 14511-2:2022. [Google Scholar]
- DIN EN 14825:2023-10: Air conditioners, liquid chilling packages and heat pumps, with electrically driven compressors, for space heating and cooling, commercial and process cooling – Testing and rating at part load conditions and calculation of seasonal performance; German version EN 14825:2022. [Google Scholar]
- DIN EN 14511-3:2023-12: Air conditioners, liquid chilling packages and heat pumps for space heating and cooling and process chillers, with electrically driven compressors – Part 3: Test methods; German version EN 14511-3:2022. [Google Scholar]
- T. Oltersdorf, H. Fugmann, L. Schnabel: European Heat Pump Market Data – Evolution of the state of the art heat pump over time and its possible knowledge gain, in: 14th IEA Heat Pump Conference, Chicago, 2023 [Google Scholar]
- Stiftung Warentest: test Oktober (2023), 62–67 [Google Scholar]
- Bundesverband Wärmepumpe (BWP) e.V.: Schallrechner. https://www.waermepumpe.de/schallrechner/, last accessed on 27.12.2023. [Google Scholar]
- UK Department of Energy and Climate Change: Acoustic Noise Measurements of Air Source Heat Pumps (EE2014), 2011 [Google Scholar]
- M. Torjussen, et al.: Noise from ASHPS – What Do We Know in ACOUSTICS 2023. Institute of Acoustics, Winchester, 2023, https://doi.org/10.25144/16604 [Google Scholar]
- E. Langerova, J. Kralicek, M. Kucera, Air-to-water heat pump noise in residential settings: a comprehensive review. Renewable and Sustainable Energy Reviews 207 (2025) 114968 [Google Scholar]
- F. Bessac: Final Report Part 8 Annex 51: Acoustic Signatures of Heat Pumps: 2.3: Seasonal Sound Power Level, 2022 [Google Scholar]
- C.H. Stignor, O. Gustafsson, H. Hellgren: Heat Pump Noise Operation Dependence and Seasonal Averaging. Congress of Refrigiration, 2019 [Google Scholar]
- C.H. Kasess, C. Reichl, H. Waubke, P. Majdak: Perception Rating of the Acoustic Emissions of Heat Pumps. Forum Acusticum Lyon, France (2020), pp. 2453–2458 [Google Scholar]
- C. Vering, J. Klingebiel, C. Reichl, J. Emhofer, M. Nürenberg, D. Müller: Simultaneous energy efficiency and acoustic evaluation of heat pump systems using dynamic simulation models, in: HPC Foundation, 13th IEA Heat Pump Conference Jeju, Korea, 2021 [Google Scholar]
- J. Klingebiel, F. Will, M. Beckschulte, C. Vering, D. Müller: Data-driven Model Predictive Control for Energy-Efficient and Low-Noise Operation of Air-Source Heat Pumps. ECOS, Greece, 2024 [Google Scholar]
- C. Vering: Optimal Design of heat pump systems for existing buildings. Dissertation, RWTH Aachen University, 2023 [Google Scholar]
- T.K.B. Fajar, P.R. Bagas, S. Ukhi, M.I. Alhamid, A. Lubis: Energy and exergy analysis of an R410A small vapor compression system retrofitted with R290. Case Studies in Thermal Engineering 21 (2020) 100671 [Google Scholar]
- F. Czwielong, F. Krömer, S. Becker: Experimental investigations of the sound emission of axial fans under the influence of suction-side heat exchangers, in: 25th AIAA/CEAS Aeroacoustics Conference. American Institute of Aeronautics and Astronautics, Delft, The Netherlands, 2019 [Google Scholar]
- DIN EN 13771-1:2017-04: Compressors and condensing units for refrigeration – Performance testing and test methods – Part 1: Refrigerant compressors; German version EN 13771-1:2016. [Google Scholar]
- D.A. Pfeil: Untersuchung des Langzeitverhaltens von Wärmepumpen und den darin eingesetzten hermetischen Kältemittelkompressoren. Dissertation (1. Auflage). Forschungsberichte des Deutschen Kälte- und Klimatechnischen Vereins e.V: Nr. 90, 2021 [Google Scholar]
- DIN EN ISO 3745:2017-10: Acoustics – Determination of sound power levels and sound energy levels of noise sources using sound pressure – Precision methods for anechoic rooms and hemi-anechoic rooms (ISO 3745:2012 + Amd 1:2017); German version EN ISO 3745:2012 + A1:2017. [Google Scholar]
- Air-Conditioning, Heating, and Refrigeration Institute: ANSI/AHRI 530-2022 (SI): Rating of Sound and Vibration for Positive Displacement Refrigerant Compressors, 2022 [Google Scholar]
- Japan Society of Refrigerating and Air Conditioning Engineers: Compressors for air conditioning and refrigeration, JSRAE Technical Book Series, 2018 [Google Scholar]
- DIN EN ISO 3744:2011-02: Acoustics – Determination of sound power levels and sound energy levels of noise sources using sound pressure – Engineering methods for an essentially free field over a reflecting plane (ISO 3744:2010); German version EN ISO 3744:2010. [Google Scholar]
- T. Carolus: Ventilatoren, Aerodynamischer Entwurf – Konstruktive Lärmminderung – Optimierung. Springer Vieweg, 2021 [Google Scholar]
- ISO 13347-3: Industrial fans – Determination of fan sound power levels under standardized laboratory conditions – Part 3: Enveloping surface methods, 2004 [Google Scholar]
- E. Reichert: Förderprojekt LowNoise Messergebnisse AxiTone 500, Internal Project Report: PN315257, PN316001, ebm-Papst Mulfingen GmbH & Co. KG, 2023 [Google Scholar]
- R.D. Madison: Fan Engineering (Handbook), 5th edition. Buffalo Forge Company, Buffalo, NY, 1949 [Google Scholar]
- DIN ISO 532-1:2022-03: Acoustics – Methods for calculating loudness – Part 1: Zwicker method (ISO 532-1:2017, Corrected version 2017-11), https://doi.org/10.31030/3248850. [Google Scholar]
- Technical Committee 26: ECMA 418-2, Psychoacoustic metrics for ITT equipment – Part 2 (Model based on human perception), 2022 [Google Scholar]
- L. Stürenburg, H. Braren, L. Aspöck, J. Fels: Recordings of an Air-to-Water Heat Pump. Zenodo, 2024, https://doi.org/10.5281/zenodo.13365535 [Google Scholar]
- DIN 45680:1997-03: Measurement and assessment of low-frequency noise immissions in the neighbourhood. https://dx.doi.org/10.31030/7211690. [Google Scholar]
- J. Song-Manguelle, S. Schröder, T. Geyer, G. Ekemb, J.M. Nyobe-Yome: Prediction of mechanical shaft failures due to pulsating torques of variable frequency drives. IEEE Transactions on Industry Applications 46, 5 (2010) 1979–1988 [Google Scholar]
- Internal Viessmann Software by M. Immel: Heat pump calculation HPC V6.2.5, 2023 [Google Scholar]
- alpha innotec: Air/Water Heat Pumps Operating Manual LWDV – series, 83055800iUKLWDV, p. 21, https://files.ait-group.net/alp/01%20heat%20pumps/01%20air%20water/07%2520LWDV/ [Google Scholar]
- Bundesregierung Deutschland: TA Lärm, Sechste Allgemeine Verwaltungsvorschrift zum Bundes-Immissionsschutzgesetz (Technische Anleitung zum Schutz gegen Lärm – TA Lärm), 1998 [Google Scholar]
- Projektträger Jülich: Verbundvorhaben: LowNoise (03EN4020B): Integrale Betrachtung, Optimierung & methodische Bewertung v. Luft-Wasser-Wärmepumpen zur Reduktion akustischer Emissionen; Teilvorhaben: Erarbeitung eines Geräuschmodells zur Beschreibung des Akustikverhaltens eines WP-Demonstrators m.d. geringsten derzeit möglichen akust. Emissionen, https://www.enargus.de/search/?q=01240403%2F1. [Google Scholar]
Cite this article as: Schmidt T. & Müller D. 2025. Sound model of an acoustic improved air to water heat pump. Acta Acustica, 9, 44. https://doi.org/10.1051/aacus/2025027.
All Tables
Standard deviation of measurement data (n=288) on compressor tests taken under stationary operating conditions.
Approaches for the four most important sound contributions based on the measurement data of the demonstrator.
Sound power levels of compressor noise LW,comp using the example of the demonstrator heat pump at standard rating condition A7W55. The overall sound power level is calculated from 50 Hz to 16 kHz.
Calculated psychoacoustic characteristic values for 32 time sections with a duration of 3 s based on a run-out measurement over a period of 10 min under controlled operating condition A7W55. The calculations are based on the recorded sound pressure levels Leq at measurement position 14, Qh is the part load heating capacity at A7W55 in %, nc is the speed of the compressor in rpm, LWA is the sound power level of the heat pump demonstrator in dB(A), N is the loudness in sone, S is the sharpness in acum, T is the tonality in tuHMS, R is the roughness in asper, and F is the fluctuation strength in vacil.
All Figures
|
Figure 1. Rating points and BIN hours distribution according to DIN 14825 [7] and operating conditions for sound labeling according to Ecodesign Directive with additional information of the minimum and maximum heating capacity Qh of the demonstrator heat pump. |
| In the text | |
|
Figure 2. Results of a Stiftung Warentest study [10] in comparison with the sound data in the BWP database [11]. |
| In the text | |
|
Figure 3. Methodical procedure for determining the relevant acoustic parameters influencing the heat pump sound of the developed demonstrator. |
| In the text | |
|
Figure 4. View and section cut view of the demonstrator heat pump. (a) Heat pump demonstrator used for the sound model. (b) Principle sketch of the initial heat pump with two fans on the left-hand side of the appliance and a view of the machine room on the right-hand side. |
| In the text | |
|
Figure 5. Test setup in a hemi-anechoic chamber and the compressor test bench in an adjacent room. |
| In the text | |
|
Figure 6. Comparison of the sound power level (class 2 σ=1.5 dB [28]) of different refrigerant compressors. (a) Overall value 20 Hz to 10 kHz. (b) Bandpass filter 20 Hz to 400 Hz. (c) Bandpass filter 400 Hz to 800 Hz. (d) Bandpass filter 400 Hz to 3 kHz. |
| In the text | |
|
Figure 7. Factors influencing the sound power level (class 1 σ=0.5 dB [25]) of three different refrigerant compressors, based on measurements (n=288) taken under stationary operating conditions with test method one factor at a time. |
| In the text | |
|
Figure 8. Combined acoustic and performance test bench at company ebm-papst Mulfingen GmbH & Co. KG with demonstrator heat pump test sample (left) suction side view (right) pressure side view [31]. |
| In the text | |
|
Figure 9. Acoustic development of the air-to-water heat pump demonstrator in a hemi-anechoic chamber. |
| In the text | |
|
Figure 10. Results of the fan comparison. (a) Acoustic behavior of two different fan systems installed in the demonstrator heat pump, diameter correspond to 500 mm. (b) Pressure characteristic curves as sum of two fans, based on measurements installed in the heat pump, curves below the heat pump characteristic curve extrapolated by quadratic function, the design airflow of the heat pump qv,design is 5000 m3/h at a pressure difference of 20 Pa. |
| In the text | |
|
Figure 11. Test setup for sound power calculation according to DIN EN ISO 3745, measurement position 14 is used for calculating psychoacoustic parameters. |
| In the text | |
|
Figure 12. Calculated loudness for the same measurement position at free field conditions of the acoustically improved demonstrator compared to the initial heat pump and to a reference heat pump in the same capacity range, data taken from [35]. |
| In the text | |
|
Figure 13. Contribution of fan and compressor sound power levels to the overall sound power level of the demonstrator at steady state conditions for standard rating condition A7W55 and different compressor speeds from minimum to maximum possible speeds. |
| In the text | |
|
Figure 14. Influence of the pressure difference on the sound power level of the heat pump described by a variation of the flow temperature and a constant air temperature. |
| In the text | |
|
Figure 15. Spectrogram of the total sound power level of the heat pump demonstrator from a run-out measurement at A7W55 from maximum to minimum compressor speed. |
| In the text | |
|
Figure 16. Procedure for creating the sound model of the acoustically improved demonstrator. |
| In the text | |
|
Figure 17. Sound model as a function of the heating capacity for a supply temperature of 55 °C and the air temperature based on sound power measurements at standard rating condition A7W55 in a hemi-anechoic room. (1) Line of maximum sound power level of heat pump (2) example line of reduced sound power level with reduced heating capacity at nighttime (3) example line of reduced sound power level with more reduced heating capacity at nighttime. |
| In the text | |
|
Figure 18. Examples of different interpretations of maximum sound power levels. Point (a) represents a maximum sound power level at an air temperature of 7 °C with reduced rotational speeds of fan and compressor when the heating capacity is limited for higher air temperatures, Point (b) is an example when the maximum sound power level is declared for cummulated bin hours >75% for an average climate [7] and line (c) shows a reduced maximum sound powel with very low heating capacity. |
| In the text | |
|
Figure A.1. Approximation of the influence of the fan operation on the sound power level for variation of the pressure drop on the basis of the results of fan A. |
| In the text | |
|
Figure A.2. Influence on compressor sound power level at system level in the heat pump demonstrator for N=21 different compressor speeds at standard rating conditions A7W35, A7W55 and A7W65. |
| In the text | |
|
Figure A.3. Approximation of the influence on compressor sound power for different outlet temperatures based on the average deviation of the A-weighted measurements. |
| In the text | |
|
Figure A.4. Spectrogram of the total sound power level of the heat pump demonstrator from a run-out measurement at A7W55 from maximum to minimum compressor speed with extended frequency range. The main noise components are in the frequency range below 5 kHz. the components at 3 kHz and 7.2 kHz can be assigned to the compressor noise mainly exhaust by pressure pulsation. The VFD sounds have a minor contribution in this case, the carrier frequency of compressor drive is 6 kHz, the expanding sidebands correspondent to the switching frequencies, the VFD sound of fan motor is at 16 kHz. |
| In the text | |
|
Figure A.5. Results of a directivity analysis for a heat pump demonstrator with low noise emission, the directivity of the sum level dominates towards the rear and front. The difference is approx. 5 dB to the sides. The directivity of the level-determining component of the 3.15 kHz one third octave band is more complex with a maximum in the left-rear direction (angle of approx. −150°). (a) Test setup for directivity analysis with 24 additional microphones on a circular measuring surface (cf. Fig. 11) and an angular distance of 15°. (b) Directivity characteristic of the overall sound power level and the level-determining one third octave band 3.15 kHz on the basis of a run out measurement at condition A7W55, 1 s time blocks from maximum to minimum heating capacity. The arrow describes the direction of the air flow, the compressor symbol the position of the machine room with the refrigerant circuit. |
| In the text | |
Current usage metrics show cumulative count of Article Views (full-text article views including HTML views, PDF and ePub downloads, according to the available data) and Abstracts Views on Vision4Press platform.
Data correspond to usage on the plateform after 2015. The current usage metrics is available 48-96 hours after online publication and is updated daily on week days.
Initial download of the metrics may take a while.