Figure 3
Download original image
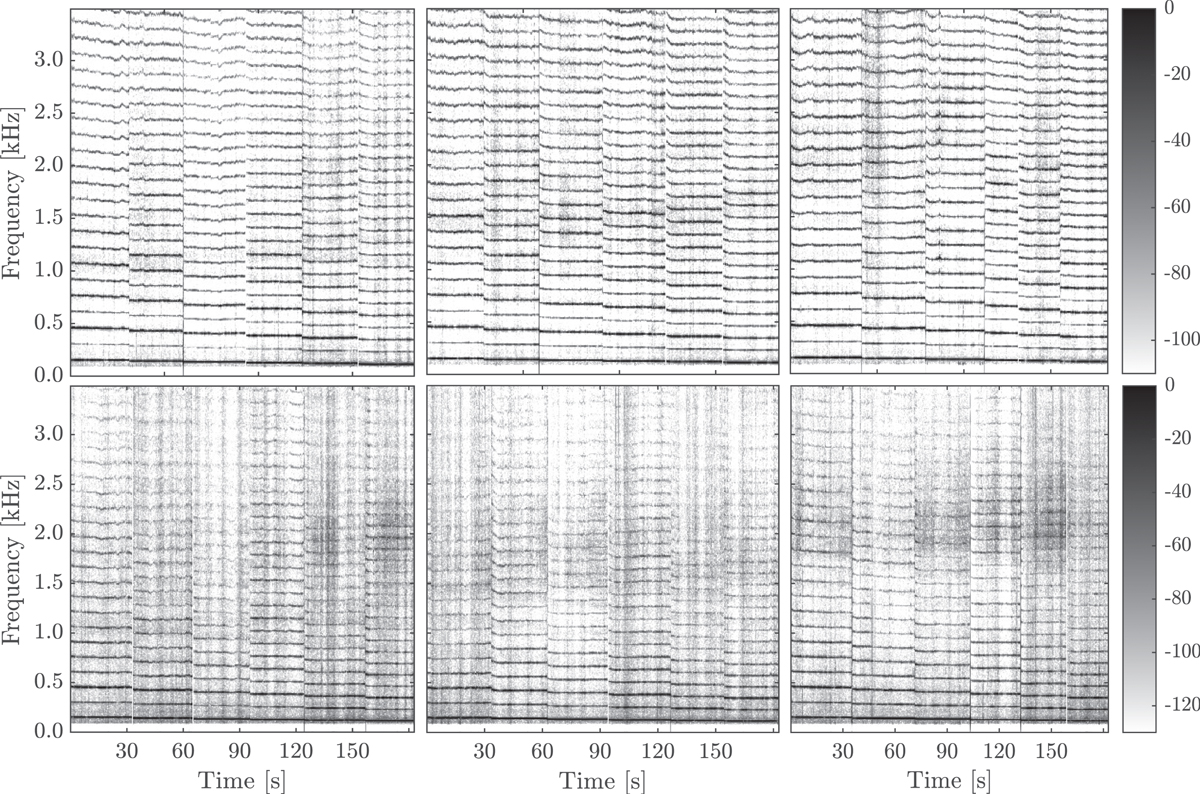
Spectrograms of six notes played in a descending scale using a clarinet mouthpiece. Top panels at forte and bottom panels at piano playing levels for resonators with, from left to right, f c = 1.0, 1.5, 2.0 kHz. The analysis is performed on composite signals from the Neumann U87 and two Neumann KM 184. Color map in decibels.
Current usage metrics show cumulative count of Article Views (full-text article views including HTML views, PDF and ePub downloads, according to the available data) and Abstracts Views on Vision4Press platform.
Data correspond to usage on the plateform after 2015. The current usage metrics is available 48-96 hours after online publication and is updated daily on week days.
Initial download of the metrics may take a while.