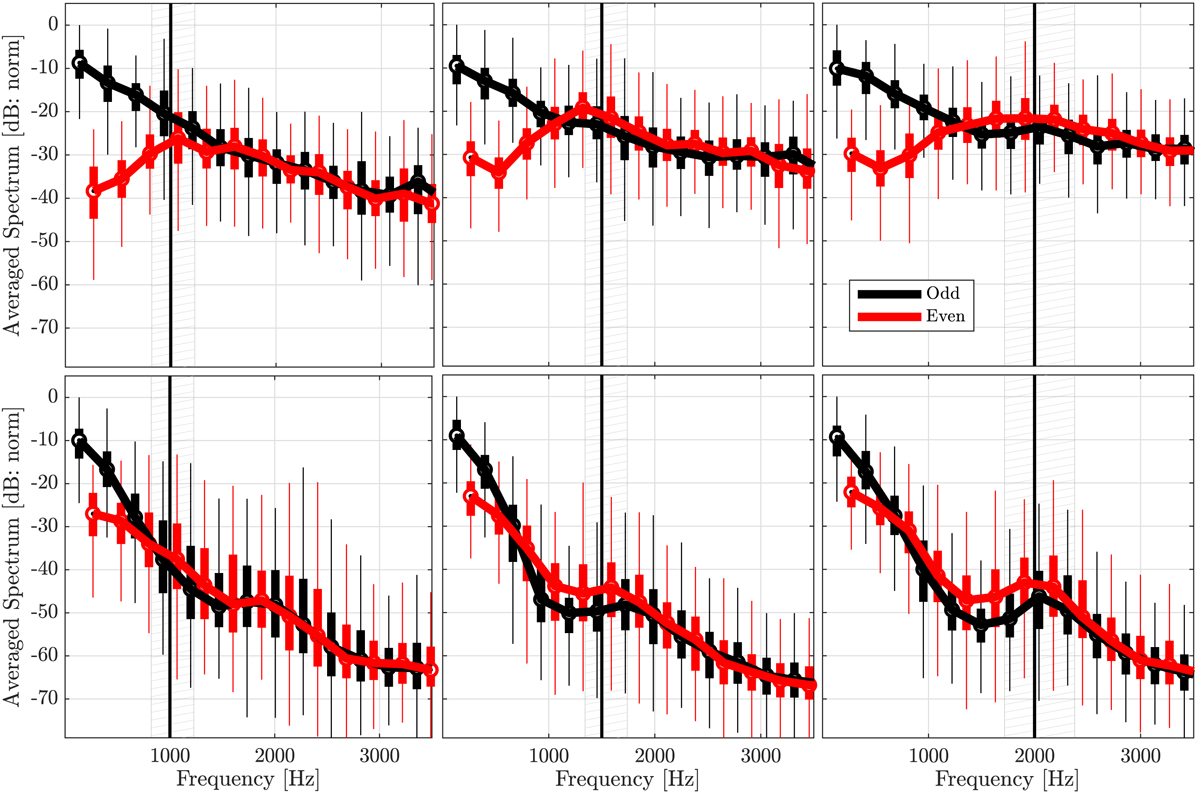
Figure 4
Download original image
Measured external spectra, averaged over six notes played on each of three resonators with different cutoff frequencies. Top panels depict forte dynamics and bottom panels depict piano dynamics. Each box plot is computed from the n th rank harmonic to present an averaged spectra that is characteristic to the resonator across different fingerings with fundamentals ranging from 114 Hz to 154 Hz, and is positioned at the average frequency of the respective n th rank harmonic. Data from manually waved microphone (Neumann U87 4 m distance). Black: odd harmonics, red: even harmonics, vertical line: cutoff frequency of the resonator. Box plots within hatched area have atleast one harmonic near cutoff. Solid black and red lines trace the median of each box plot. The median amplitude of the fundamentals are normalized to 0 dB in each panel. Boxes span from 25th to 75th percentiles and thin lines show the span of the data ignoring outliers.
Current usage metrics show cumulative count of Article Views (full-text article views including HTML views, PDF and ePub downloads, according to the available data) and Abstracts Views on Vision4Press platform.
Data correspond to usage on the plateform after 2015. The current usage metrics is available 48-96 hours after online publication and is updated daily on week days.
Initial download of the metrics may take a while.