Figure 6
Download original image
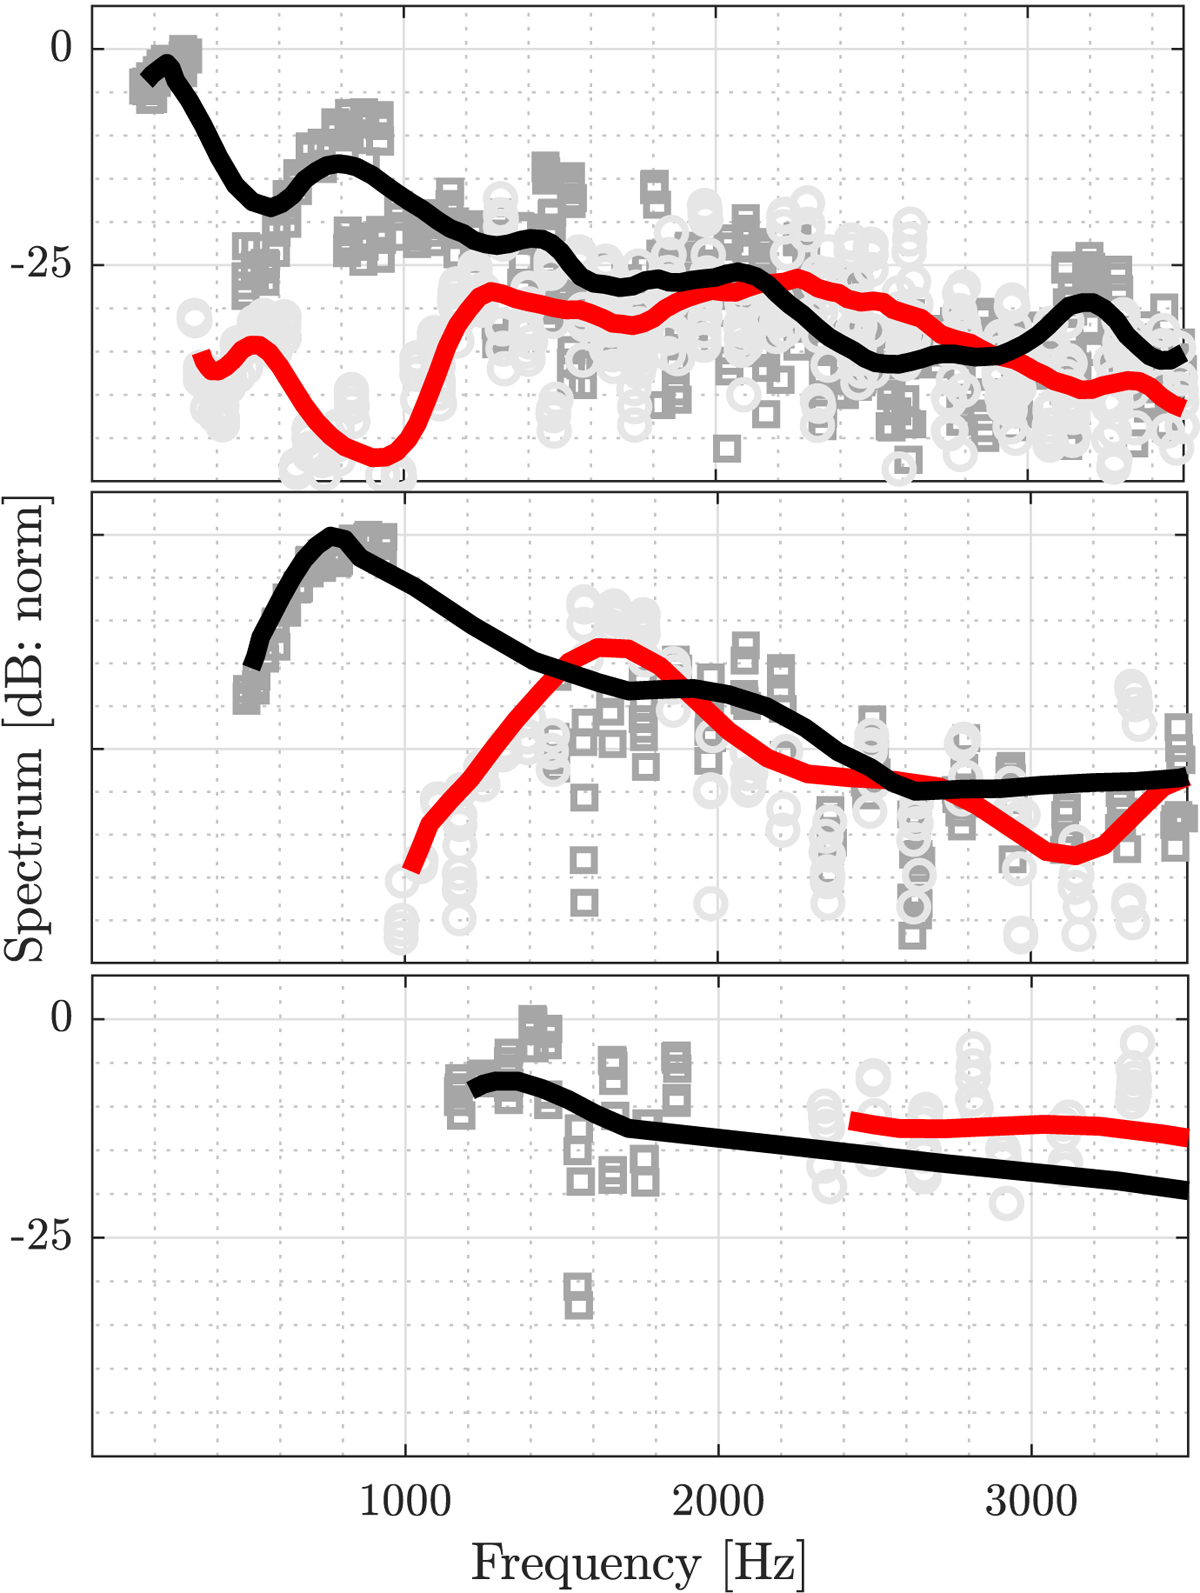
Radiated spectra of a real clarinet measured in anechoic conditions played at a forte level. Portions of the first (E3–E4), second (B4-A♯5), and third (D6-A♯6) registers are plotted from top to bottom. Raw data depicted by dark grey and light grey circles, plus their moving average by black and red lines, for odd and even harmonics, respectively. Data accessed through a publicly available data base [28].
Current usage metrics show cumulative count of Article Views (full-text article views including HTML views, PDF and ePub downloads, according to the available data) and Abstracts Views on Vision4Press platform.
Data correspond to usage on the plateform after 2015. The current usage metrics is available 48-96 hours after online publication and is updated daily on week days.
Initial download of the metrics may take a while.