Open Access
Figure 11
Download original image
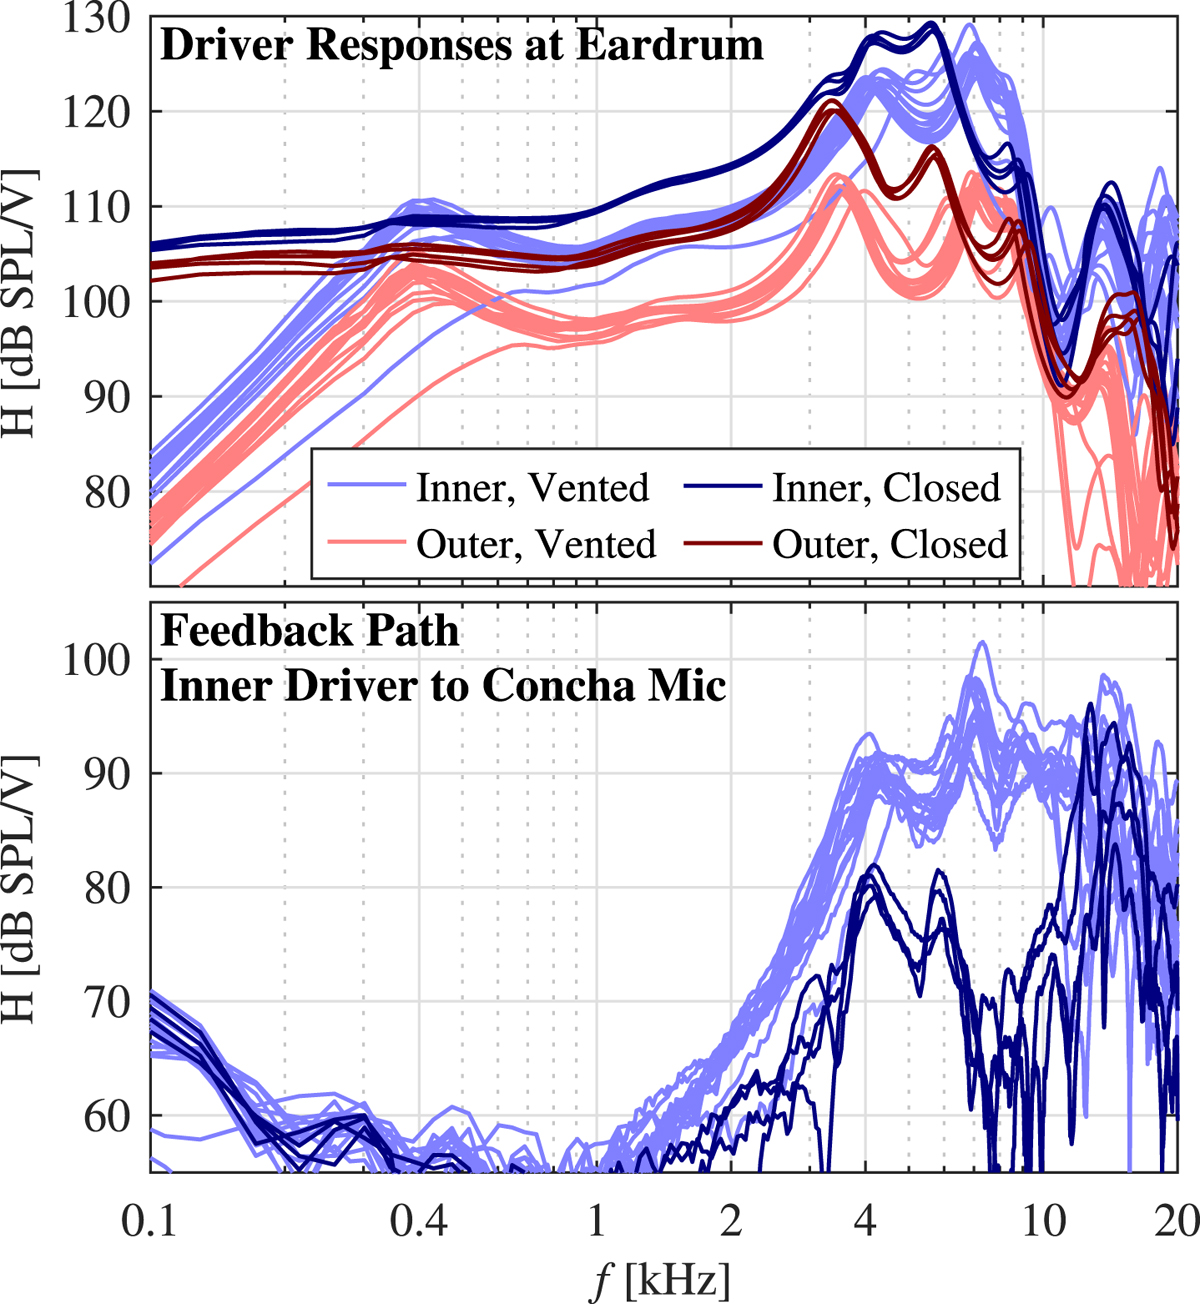
Serial variation of the driver responses measured in KEMAR with 8 device pairs, each line representing one device side. The inner driver results are plotted in blue, outer driver results in red. Light colours indicate the vented version of the device, dark colors the closed version.
Current usage metrics show cumulative count of Article Views (full-text article views including HTML views, PDF and ePub downloads, according to the available data) and Abstracts Views on Vision4Press platform.
Data correspond to usage on the plateform after 2015. The current usage metrics is available 48-96 hours after online publication and is updated daily on week days.
Initial download of the metrics may take a while.