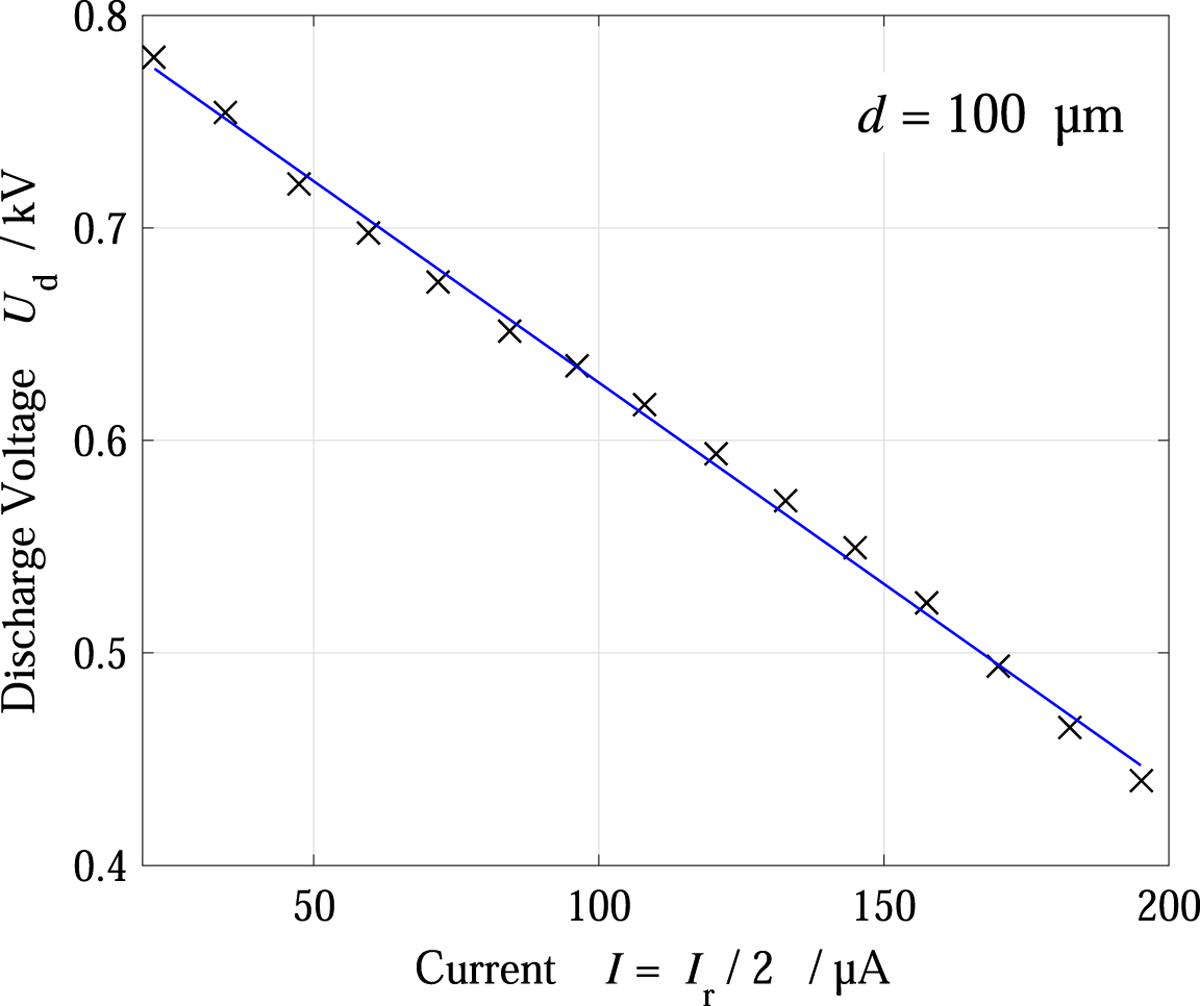
Figure 4
Download original image
Variation of voltage Ud with mean current I associated with a microstructured electrode array: two electrodes with 170 points and a wire electrode (see Fig. 2). Comparison between experimental data (×××) and empirical model (–), Equation (2), with the adjusted parameters Us ≃ 820 V and Rd ≃ −1.9 MΩ deduced from a least squares method.
Current usage metrics show cumulative count of Article Views (full-text article views including HTML views, PDF and ePub downloads, according to the available data) and Abstracts Views on Vision4Press platform.
Data correspond to usage on the plateform after 2015. The current usage metrics is available 48-96 hours after online publication and is updated daily on week days.
Initial download of the metrics may take a while.