Open Access
Figure 7
Download original image
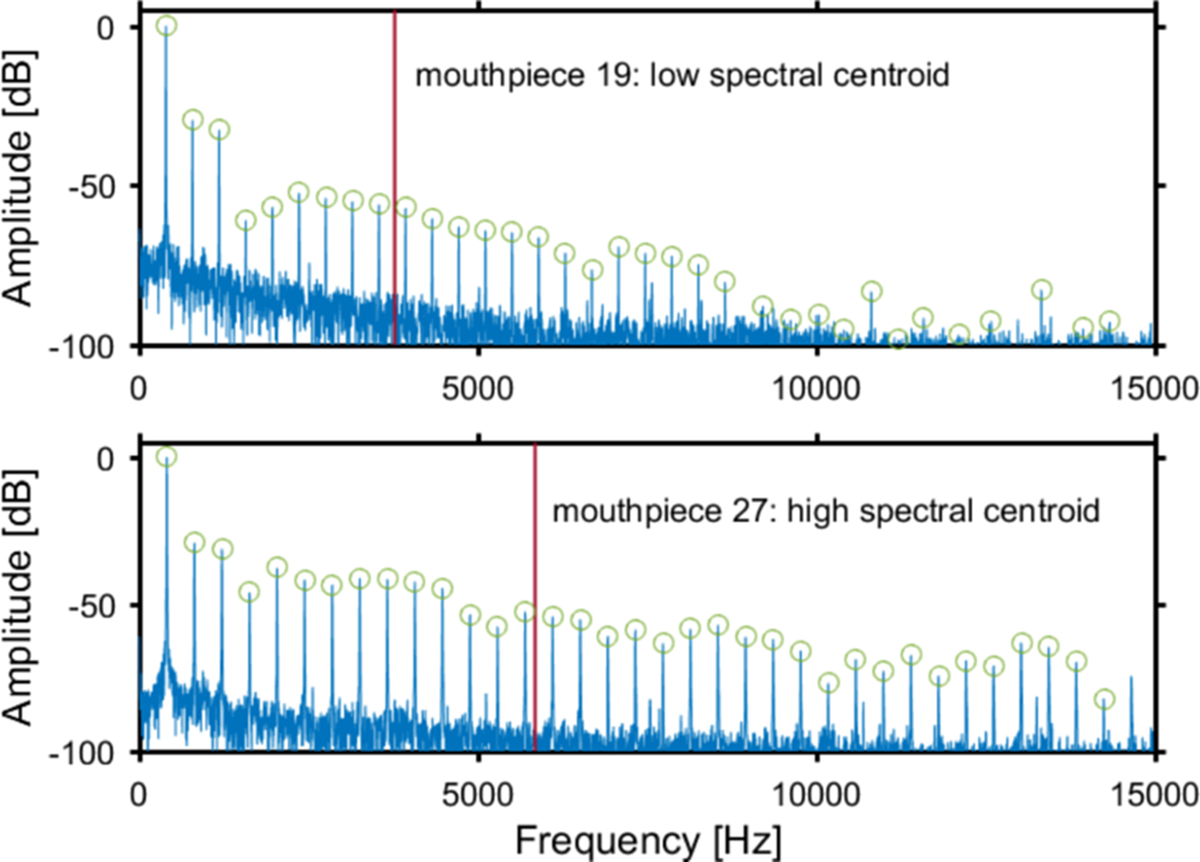
Spectra of the mouthpiece-pressure signal comparing two mouthpieces with low and high spectral centroid (marked as a vertical line). The spectral centroid is calculated by considering the amplitude of the first 35 peaks of the spectrum (marked with circles).
Current usage metrics show cumulative count of Article Views (full-text article views including HTML views, PDF and ePub downloads, according to the available data) and Abstracts Views on Vision4Press platform.
Data correspond to usage on the plateform after 2015. The current usage metrics is available 48-96 hours after online publication and is updated daily on week days.
Initial download of the metrics may take a while.