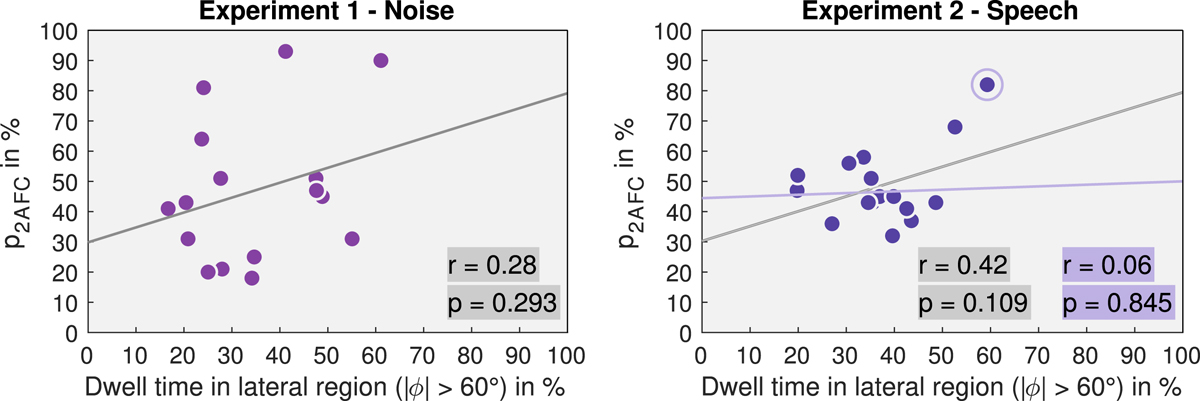
Figure 5
Download original image
Participants’ dwell time in lateral region (|ϕ| > 60°) vs. their percentage of correct answers p2AFC for Experiment 1 (left) and Experiment 2 (right). The solid line is the least-squares line of best fit. The right plot shows in purple the results of the correlation analysis for Experiment 2, excluding the outlier (data point circled in purple).
Current usage metrics show cumulative count of Article Views (full-text article views including HTML views, PDF and ePub downloads, according to the available data) and Abstracts Views on Vision4Press platform.
Data correspond to usage on the plateform after 2015. The current usage metrics is available 48-96 hours after online publication and is updated daily on week days.
Initial download of the metrics may take a while.