Figure 5
Download original image
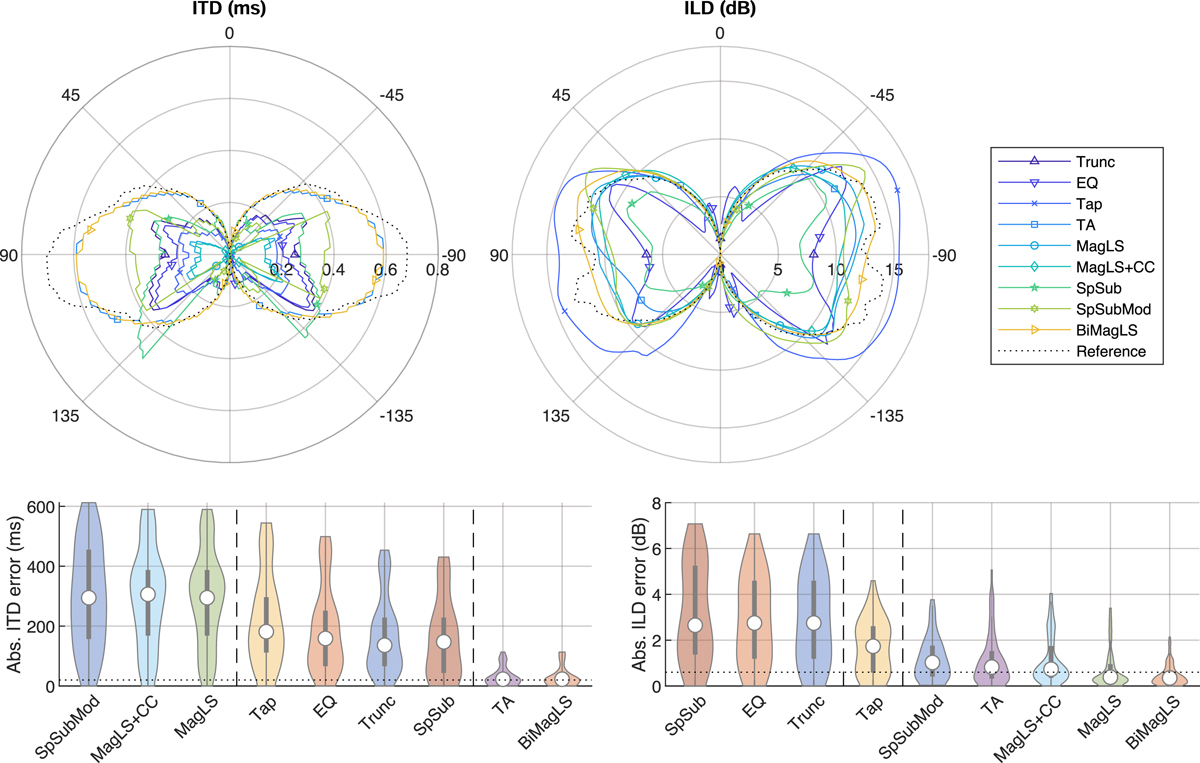
Top: Interaural time differences (ITD) and interaural level differences (ILD), plotted as a function of azimuth on the horizontal plane for HRTFs preprocessed with the nine methods at N = 3 and interpolated. Bottom: violin plots showing the absolute ITD and ILD errors for each HRTF on the horizontal plane, where the dotted lines represent the approximate JNDs in anechoic conditions, according to Klockgether and van de Par [63], and the vertical dashed lines indicate that the groups on the left are significantly different (p < 0.05) than the groups on the right.
Current usage metrics show cumulative count of Article Views (full-text article views including HTML views, PDF and ePub downloads, according to the available data) and Abstracts Views on Vision4Press platform.
Data correspond to usage on the plateform after 2015. The current usage metrics is available 48-96 hours after online publication and is updated daily on week days.
Initial download of the metrics may take a while.