Figure 10
Download original image
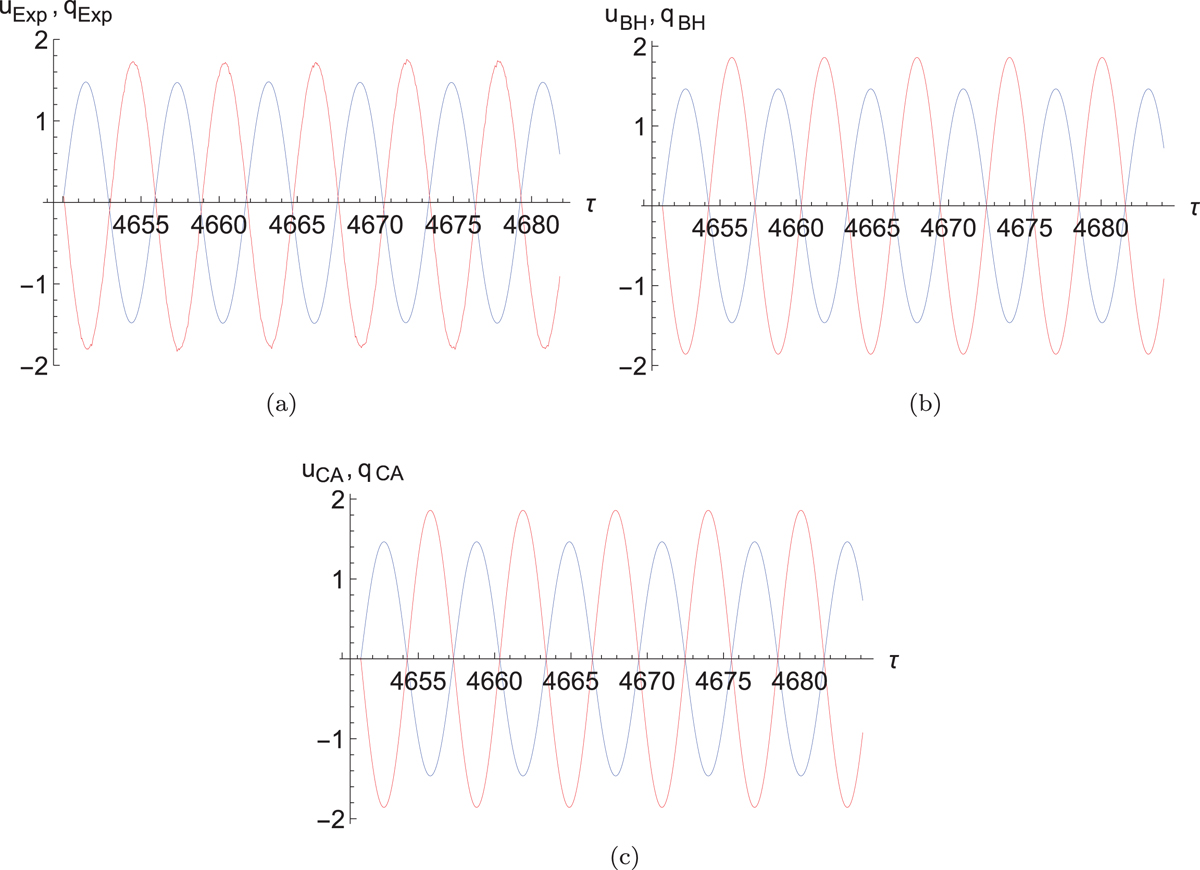
Time series of the two degrees of freedom of the system. f = 85 Hz, V = 0.025 V. The blue curves show the scaled displacement of the air at the end of the tube and the red curves show the scaled displacement at the center of the membrane. Top left: measured time responses. Top right: the numerically determined time responses using the parameters identified from the HBM. Bottom: the temporal responses determined numerically using the parameters identified from the CX-A method. Configuration 1: hm = 0.23 mm, Rm = 5 cm, fm = 45 Hz. (a) The measured time responses. (b) The numerically determined time responses using the parameters identified from the HBM. (c) The numerically determined time responses using the parameters identified from the CX-A method.
Current usage metrics show cumulative count of Article Views (full-text article views including HTML views, PDF and ePub downloads, according to the available data) and Abstracts Views on Vision4Press platform.
Data correspond to usage on the plateform after 2015. The current usage metrics is available 48-96 hours after online publication and is updated daily on week days.
Initial download of the metrics may take a while.