Figure 9
Download original image
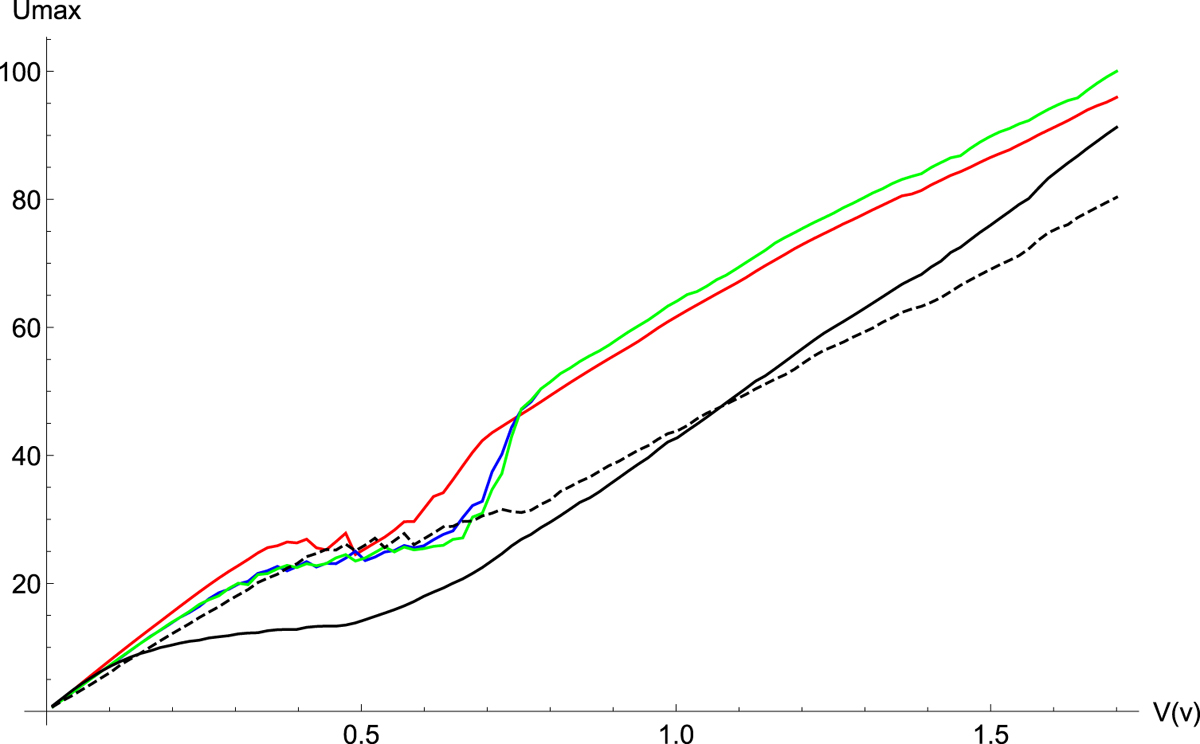
Ridge curves of U (maximum amplitudes over all frequency range). Red: normalized experimental data. Blue: numerical integration of the equations with parameters identified by HBM. Green: numerical integration with parameters identified by CX-A. Continuous black: numerical integration with parameters determined experimentally at low excitation amplitude. Dashed black: numerical intergration with the mean parameters determined by HBM inside the pumping zone. Configuration 1: hm = 0.23 mm, Rm = 5 cm, fm = 45 Hz.
Current usage metrics show cumulative count of Article Views (full-text article views including HTML views, PDF and ePub downloads, according to the available data) and Abstracts Views on Vision4Press platform.
Data correspond to usage on the plateform after 2015. The current usage metrics is available 48-96 hours after online publication and is updated daily on week days.
Initial download of the metrics may take a while.