Open Access
Figure 4
Download original image
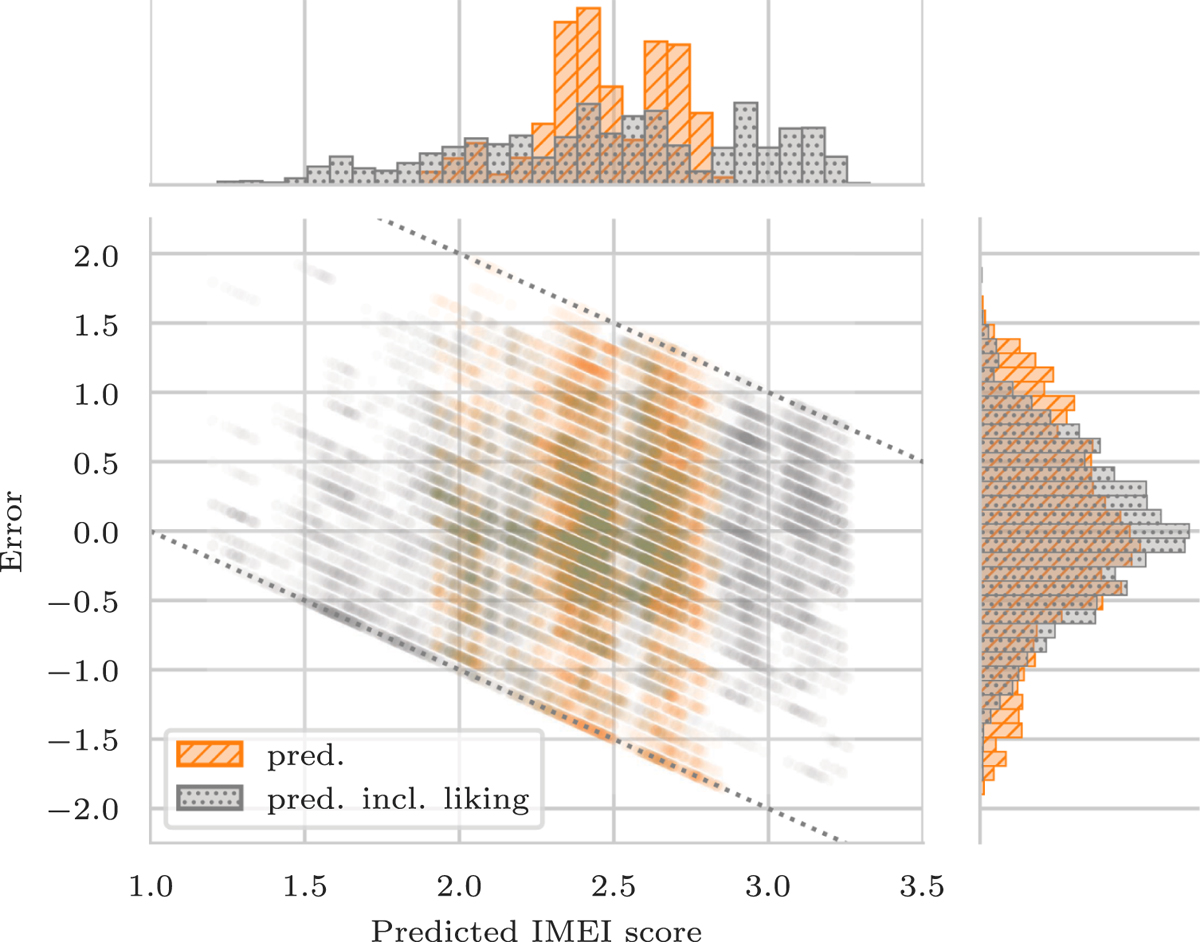
Errors plotted against predicted IMEI scores in the cross-validation procedure for a model specification according to Table 5 and one additionally including liking. Marginal distributions are displayed as histograms. Minimum and maximum possible errors due to boundedness of IMEI scores are indicated by dotted lines.
Current usage metrics show cumulative count of Article Views (full-text article views including HTML views, PDF and ePub downloads, according to the available data) and Abstracts Views on Vision4Press platform.
Data correspond to usage on the plateform after 2015. The current usage metrics is available 48-96 hours after online publication and is updated daily on week days.
Initial download of the metrics may take a while.