| Issue |
Acta Acust.
Volume 8, 2024
|
|
|---|---|---|
| Article Number | 13 | |
| Number of page(s) | 16 | |
| Section | Aeroacoustics | |
| DOI | https://doi.org/10.1051/aacus/2024005 | |
| Published online | 15 March 2024 | |
Scientific Article
A benchmark case for aeroacoustic simulations involving fluid-structure-acoustic interaction transferred from the process of human phonation
1
Aeroacoustics and Vibroacoustics, IGTE, TU Graz, Inffeldgasse 18, 8010 Graz, Austria
2
Division of Phoniatrics and Pediatric Audiology, Department of Otorhinolaryngology, Head & Neck Surgery, Friedrich-Alexander-University Erlangen-Nürnberg, Waldstraße 1, 91054 Erlangen, Germany
3
Department of Process Machinery and Systems Engineering, Friedrich-Alexander-University Erlangen-Nürnberg, Cauerstr. 4, 91058 Erlangen, Germany
4
Institute of Fluid Mechanics, Friedrich-Alexander-University Erlangen-Nürnberg, Cauerstr. 4, 91058 Erlangen, Germany
* Corresponding author: This email address is being protected from spambots. You need JavaScript enabled to view it.
Received:
22
February
2023
Accepted:
6
February
2024
Abstract
Modeling fluid-structure-acoustic interaction is a highly challenging task and currently there is a lack of available benchmark datasets. For instance, to understand the processes of human phonation, it is essential to fully understand the fluid-structure-acoustic interaction process. In this article, a synthetic human phonation model is presented for benchmarking numerical methods in the field of aerodynamics, aeroacoustics and the highly-complex fluid-structure-acoustic interaction process of the voice production. The objective is to present the wide range of experimental data available, including the model geometry, the material characteristics, quantitiesreferred to the vocal fold dynamics, fluid mechanical quantities and the acoustic field. Firstly, the experimental setup is specified. Secondly, the experimental data is described in detail, accompanied by illustrations. Having the dataset in hand, finally, it is shown how to use this data to validate a computational phonation model called simVoice successfully. In conclusion, this benchmarking dataset offers the opportunity to validate structural dynamics, aerodynamics and aeroacoustics of a highly-complex fluid-structure-acoustic interaction simulation, obtained from different mathematical formulations and numerical procedures.
Key words: Fluid-structure-acoustics interaction / Human voice production / SynthVoice / SimVoice / Benchmark dataset
© The Author(s), Published by EDP Sciences, 2023
 This is an Open Access article distributed under the terms of the Creative Commons Attribution License (https://creativecommons.org/licenses/by/4.0), which permits unrestricted use, distribution, and reproduction in any medium, provided the original work is properly cited.
1 Introduction
The human phonation is the sound generation process during human speech. It occurs in the larynx and predominantly produces voiced sound for vowel articulation. Unvoiced speech sounds as consonants are generated in the oral cavity by explosive flow releases for plosives and by narrowing the flow path by the tongue, the palate, and the teeth and therewith by increasing the flow velocity for fricatives.
The phonation process is a highly complex interaction between the tracheal airflow, the (myo-)elastic tissue in the larynx and the acoustic properties of the vocal tract (fluid-structure-acoustic interaction), which is composed of the upper airways up to the mouth [1–3]. There are two tissue folds in the larynx called vocal folds that are excited to periodical oscillations by the exhalation airflow, see Figure 1b. Due to these oscillations, the airflow is interrupted intermittently when the vocal folds close the gap in between called glottis and generate a pulsatile jet just above the vocal folds. Thereby, the amplitude and frequency of the vocal folds oscillations are controlled by the frame of moving laryngeal cartilages which posture the vocal folds before the phonation starts. This process constitutes the production of the primary sound of the human voice which is spectrally composed of the harmonic tone series of the fundamental frequency (i.e. oscillation frequency) and especially in cases of voice disorders with additional broadband sound components [1, 4]. This primary sound signal is subsequently modulated in the vocal tract, see Figure 1, by resonance effects that filter specific tones, the so-called formants, to the voice spectrum which are independent of the harmonic tones produced by the vocal folds oscillation [3, 5]. The frequencies of the first two formants are the characteristic features that produce the acoustic sensation of a specific vowel.
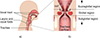 |
Figure 1 Schematic pictures of a) a human head in a sagittal cut and b) the larynx in a coronal cut, showing the Vocal Folds (VF) and the Ventricular Folds (VeF). |
The large challenge from a clinical perspective is that the whole complexity of the process cannot be overall analyzed by experimental and diagnostic methods in living subjects or patients as the region of interest goes down deep in the larynx. As a result, a large scientific community has been developed since in the middle of the last century [5, 6] composed of engineers, natural scientists and physicians who developed experimental and computational models of the larynx [7–10]. In this scientific process, Scherer et al. [11] developed the widely applied geometrical M5 model of the vocal folds based on anatomical and physiological characteristics of human vocal folds. Afterwards, this model was included in many experimental [12–18] and computational models [16, 19–22] and therefore constitutes a highly established and well-documented model of the vocal folds. Although these models constitutes simple models with simplified geometries of the VFs and rectangular or ideally circular cross-sections of the flow channels, they have advantages compared to ex-vivo animal or human cadaver larynges as a much longer experimental time as well as more reproducible conditions and better accessibility for measuring techniques [8, 23]. Thus, those models delivered relevant insights in physiological [24–26] and pathological phonation cases [13, 27, 28] and were even used to develop diagnostic tools in clinical phoniatrics [29–31].
The conducted literature study found that no well-documented datasets are available that describe the detailed voice generation process and can serve as a validation for high-fidelity human voice computation. This article aims to collect, structure, describe, and to its end, provide the experimentally obtained data as a documented benchmark test case to the community. The benchmark dataset will be of interest for two reasons. Firstly, a human voice simulation model can be validated against well-described physical quantities within the larynx and vocal tract region and the acoustic signal in the free field. Secondly and most important for the physical understanding, the dataset serves as a first benchmark for fluid-structure-acoustic interaction problems, including complete contact of the opposing vocal folds. This structure interaction (contact) periodically constricts the flow and separates the flow domain into two, which is a huge challenge for the simulation models [32]. To conclude, there is a high scientific potential in providing a dataset addressing the scientific community’s interests.
2 Benchmark
2.1 Experimental model – synthVOICE
The experimental test setup is assembled of a mass flow generator [33], an aeroacoustic silencer, and the synthetic larynx model synthVOICE, see Figure 2. Therein, two elastic silicone vocal fold models are fixed within a mounting frame being on the top of the subglottal channel. The subglottal channel and the mounting frame consist of aluminum. The supraglottal test channel downstream of the vocal folds comprises two transparent walls made of acrylic glass and two lateral walls made of aluminum. In a distance of 5 mm downstream of the vocal folds, the two ventricular folds were optionally inserted, as shown in Figure 4.
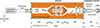 |
Figure 2 Synthetic larynx model with massflow generator, silencer, subglottal channel and silicone vocal fold models. |
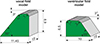 |
Figure 3 Geometrical dimension of the M5 vocal fold model and the ventricular fold model. |
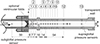 |
Figure 4 Synthetic larynx model and supraglottal channel with optional Ventricular Folds (VeF), subglottal and 39 supraglottal pressure sensors. |
The flow region along the entire model has a rectangular cross-section with dy × dz = 18 × 15 mm2 representing the lateral-longitudinal orientation of the glottis. The length of both sub- and supraglottal channel amount 190 mm resulting in the lowest acoustical resonance frequency of approx. 430 Hz by considering the channels as half-open resonators [34].
The silicone vocal folds showed flow-driven, self-sustained oscillations similar to human vocal folds during normal phonation [35, 36]. They have the shape of the M5 model [11, 37] shown in Figure 3 and consisted of the three-component silicone rubber Smooth-On ECOFLEX 30 (Smooth-On Inc., Macungie, PA) that was mixed with ratio 1–1–3 related to the volumetric fraction of Part A–Part B–Silicone Thinner of ECOFLEX. After curing, the silicone possesses a Young’s modulus of E = 4.4 kPa, which is in the range of those found in vocal fold tissue [2]. The poisson ratio of the silicone amounted 0.499 and the density is 976 kg/m3. The size and dimensions of the larynx model are on the human length scale [8, 9]. In this study, one pair of silicone models was used. The shape of the ventricular folds was derived from the M5 vocal fold shape as shown in Figure 3 and was cast consisted of hard plastic. The size was adapted to generate a ventricular gap in between the two ventricular folds amounting 5 mm, Figure 4 according to physiological measures [25]. To induce stable periodical vibrations, the flow rate was increased above threshold. For the three test configurations, the applied subglottal pressure and the resulting fundamental frequency are shown in Table 1. Additionally, the table shows the type of available data for the benchmark case. Detailed information about the entire flow channel can be found in [38–40].

2.2 Measuring setups
The available experimental data were measured in three separate measuring sessions because the different measuring equipment and setups did not allow for a complete synchronous acquisition. Especially the sound measurement required a low noise environment which excluded i.e. high-speed cameras and laser systems due to the immense noise production of integrated cooling devices. The three sessions are listed in Table 1 including the measured data.
2.2.1 Pressure measuring setup of acoustic and aerodynamic pressures
A schematic of the measuring setup is displayed in Figure 4. It shows the synthetic larynx model with a straight supraglottal channel with a rectangular cross-section (dimensions 0.018 × 0.015 m2). The aerodynamic pressure was measured at 40 positions along the flow channel with 40 Kulite XCQ-093 pressure sensors flash-mounted in the channel wall. One sensor was located 0.05 m upstream of the glottal exit to measure the subglottal pressure. The remaining 39 sensors were arranged at 13 distances downstream to the glottal exit in supraglottal channel, as displayed in Figure 4.
The sound pressure was measured by four Bruel & Kjaer 4189-L-001 1/2″ microphones positioned downstream of the supraglottal channel exit. The microphones were homogeneously distributed around the supraglottal channel at a distance of 1 m to the channel outlet each with an inclination angle of 45° to the channel axis.
All sensors were controlled with a LabView script and the measuring quantities were synchronously sampled by five National Instruments NI PXIe-4331 bridge modules for the 40 aerodynamic pressure sensors and a NI PXIe 4496 AC acquisition board with 24-bit resolution for the four microphones. The data were acquired with 24-bit resolution and sampling frequency of fs = 44.1 kHz within a time interval of 60 s. All subsequent post-processing procedures were performed in Matlab.
2.2.2 High-speed visualization of vocal fold vibration
The experimental setup for the high-speed visualization of the vocal folds vibration is shown in Figure 5. The vocal fold’s vibration was recorded from a superior perspective by a Photron SA1.1 high-speed camera. The framerate was 4000 fps with resolutions of 512 × 512 pixels for the case without and 1024 × 1024 pixels for the case with VeFs. The recording length amounted 0.125 s which corresponds to 500 frames or approx. 18 oscillation cycles of the vocal folds per video. Simultaneously, the subglottal pressure was measured by the Kulite XCQ-93 pressure sensor as described above using a sampling frequency of fs = 100 kHz by a NI PXIe-6356 multifunctional acquisition board. This card also allows to sample the digital recording signal from the camera to assign the recorded pictures to the instantaneous pressure signal.
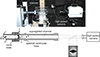 |
Figure 5 Schematic picture and photo of the experimental setup for the high-speed visualization of the vocal folds vibration. |
For analysis, the glottal area was segmented in each video frame using the software package Glottis Analysis Tools (GAT) [41]. The result is the so-called Glottal Area Waveform (GAW) which is the glottal area as a function of time. The post-processing of the subglottal pressure signal and the digital recording signal from the camera was also performed in Matlab. Thus, although the exact 3D deformation of the two VFs could not be acquired, the GAW provides valid data to reproduce the vocal fold motion within a computational CFD model adequately as shown in [42].
2.2.3 High-speed flow field measurement of supraglottal flow field
The instantaneous flow velocity field was measured by High-Speed Particle-Image-Velocimetry (HS-PIV) in the 2D mid-coronal plane directly downstream of the vocal folds indicated by the Region Of Interest (ROI) of size dx × dy  39 × 18 mm2 in Figure 6. For visualizing the flow, small liquid tracer particles with a mean diameter of approx. 2 μm were produced by clinical CareFusion AirLife empty nebulizers and added into the flow upstream of the silencer. These particles followed the flow with negligible slip (Sk = 0.01 ≪ 1) and were illuminated by a pulsed laser light sheet with a thickness of approx. 1 mm which was guided into the supraglottal channel via its outlet. The laser light was scattered at the tracer particles and recorded by a Phantom v2511 high-speed camera from a perpendicular perspective to the ROI using a frame rate of fs = 10 kHz. The laser light was produced by a high-speed dual-oscillator Nd:YLF Continuum Terra PIV laser that emitted two laser beams using a frame rate of 2 × 10 kHz with a delay of 5 μs between the two pulses. Simultaneously, the subglottal pressure as well as the instances of frame recording by the high-speed camera were measured as described above.
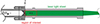 |
Figure 6 Schematic picture of the experimental setup for the 2D flow field measurement with High-Speed Particle-Image-Velocimetry. The laser light sheet was guided in the supraglottal channel in the mid-coronal plane. The motion of the tracer particles was recorded within the Region Of Interest (ROI) indicated in red. |
The PIV evaluation was performed with the ILA PIVView software package to calculate the flow velocities. The ROI was resolved by 76 × 34 square interrogation areas, each containing 32 × 32 pixels. With this resolution and measuring parameters, only 1% of the flow velocity vectors in the ROI were evaluated invalid by a normalized median test below the maximum acceptable number of outliers [43]. More detailed information can be found in [14, 40, 44].
2.3 Experimental data
The following experimental data will be shown exemplarily for each physical field: vocal fold motion, supraglottal flow field and the generated acoustic signal.
2.3.1 Vocal fold motion
The motion characteristics of the silicone vocal folds have been extensively analyzed in Kniesburges et al. [13, 24]. They showed the periodic oscillation with the fundamental frequency in the range of human phonation of adult males and females (f0 = 143 – 149 Hz) and the glottis closure in each oscillation cycle as depicted in Figure 7. Furthermore, the typical mucosal wave-like motion with the convergent-to-divergent change of the glottal duct [1] is also reproduced by the model. Figure 8 shows the GAW and the subglottal pressure  during one oscillation cycle with selected pictures of the vocal folds at selected time points. At the time points 1 and 2, the glottal duct is convergently shaped and becomes divergent between time points 2 and 3 for the rest of the cycle. As reported in [13, 38], this shape change of the glottal duct produces a short decrease of subglottal pressure between time point 2 and 3. A second local pressure decrease occurred between time point 4 (maximum glottal area) and 5 (maximum divergence angle) when the glottal duct becomes more divergent. Both effects can be explained by aerodynamic effects that increase the flow rate and therefore shortly decrease the subglottal pressure as discussed in [13].
 |
Figure 7 Pictures of the vocal folds from a superior perspective for one oscillation cycle indicated by the phase angle φ = 0 − 2π. Top row: Oscillation of the model without ventricular folds. Bottom row: Model with the ventricular folds. |
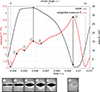 |
Figure 8 Glottal area (solid black) and subglottal pressure waveform (solid red) for one oscillation cycle (φ = 0 − 2π) with characteristic point specified. |
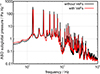 |
Figure 9 Amplitude Spectral Density of the subglottal pressure with and without VeFs. |
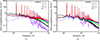 |
Figure 10 Amplitude spectral density of the supraglottal pressure at five positions according to Figure 4. (a) Supraglottal channel case without VeFs, (b) Supraglottal channel case with VeFs. |
2.3.2 Flow field
The flow field data is composed of the time-dependent wall pressure at one position in the subglottal region and 39 positions in the supraglottal channel as depicted in Figure 4. In spectral representation, both sub- and supraglottal pressure signals are assembled of the harmonic series of the fundamental frequency f0 = 149 Hz being the oscillation frequency of the vocal folds and its higher harmonics. In both supraglottal channel configurations (with and without VeFs), the amplitudes of the higher harmonic peaks decrease with increasing frequency. Furthermore, all harmonic peaks also decrease with increasing distance to the glottis, i.e. within the supraglottal channel.
Besides the harmonic series of the fundamental frequency, a second so-called subharmonic series is visible in all pressure spectra which starts with the first small subharmonic peak at f0/2. As reported in [24], this subharmonic series was aerodynamically generated in the model by cyclic variations of the glottal jet position immediately downstream of the glottis or the VeFs, respectively. Those subharmonic components are often clinically associated with diplophonia [4, 45].
The flow velocity was measured in the immediate supraglottal region for the case without VeFs. Figure 2 shows 5 instantaneous 2D flow fields within one oscillation cycle, see the experimental setup in Figure 6. Starting with the closed glottis with tiny velocity fluctuations in the flow field, the glottal jet arises at α = 54°, accelerates to its maximum velocity at α = 162° and decelerates and vanishes at α = 270° when the glottis is closed again. Based on this velocity data, Lodermeyer et al. [40] calculated the instantaneous pressure field for each flow field based on a Poisson solver [46, 47] displayed in the right portion of Figure 11.
 |
Figure 11 Resulting flow fields from the time-resolved PIV measurements at different phase angles representing different instances within an oscillation cycle. The left column depicts the velocity magnitude with the vocal fold structure in white. Additionally, vectors indicate the direction of the flow. The right column shows contour plots of the relative static pressure computed from the velocity field. Thereby, the pressure is given in reference to the ambient pressure p0. |
2.3.3 Sound field
The spectra of the sound pressure for both cases (with and without VeFs) are displayed in Figure 12. Correspondingly to the hydrodynamic pressure spectra shown in Figures 9 and 10, both sound spectra include the harmonic and subharmonic series. However, the starting subharmonic peak at f0/2 does not occur, but only the higher subharmonic peaks are visible, especially those between two harmonic peaks. As described above, the occurrence of the subharmonics can be clinically associated with diplophonia and is perceptually described as a creaky and rough voice [4]. The perceptual sensation of the sound generated in the larynx model can be described equivalently as rough and creaky. In both spectra, approx. eight distinct broadband elevations are visible starting with first at the central frequency of 700 Hz. These broadband elevations are assumed to be resonance effects in the supraglottal channel because they do not occur in the spectra for the case without a supraglottal channel as shown in [4]. From a physiological point of view, these elevations can be interpreted as the formants that acoustically control the sound characteristics of different vowels [5].
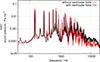 |
Figure 12 Amplitude spectral density of the generated sound for the larynx model with and without ventricular folds in the supraglottal channel analogously to Figure 4. |
The comparison between the sound spectra of both cases showed only minor differences. The harmonic and subharmonic peaks are slightly smaller for the model with the VeFs. In contrast, the broadband elevations are slightly higher if the VeFs are included.
3 Application – simVOICE
Based on the benchmark case of a synthetic larynx model, the researcher group assembled of scientists from the Friedrich-Alexander University Erlangen-Nürnberg (FAU) and the Graz University of Technology (TU Graz) developed a hybrid computational model called SimVOICE that is composed of a Computational Fluid Dynamics (CFD) and a Computational Aero-Acoustic model (CAA). For all details regarding modeling, validation and application of simVOICE, we refer to [19, 42, 48–55].
3.1 CFD model
The CFD model was developed based on the experimental model described above. It was implemented in the commercial CFD solver Starccm+ (Siemens, PLM Software, Plano, TX, USA) based on the finite volume method. The simulation was performed majorly on the high-performance computing clusters of the FAU. Beside physiological phonation conditions, the model successfully reproduced the pathological phonation cases of the clinically often observed glottis closure insufficiency and left-right asymmetric vocal fold oscillations as reported in [19].
3.1.1 Model geometry and boundary conditions
In accordance with the benchmark model shown in Figure 4, the CFD model is composed of three parts: the subglottal channel upstream of the vocal folds, the glottal duct with the two vocal folds and the supraglottal channel with optional VeFs constituting the VT, see Figure 13. The shape of the vocal folds corresponds to the M5 model [11, 17]. The geometrical dimensions exactly meet the dimensions of the experimental model and are located in the range of human length scale [1].
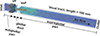 |
Figure 13 3D representation of simVoice, including a velocity field in the mid-coronal plane, the Vocal Folds (VF), the Ventricular Folds (VeF), and the rectangular vocal tract. Points P1, and P2 are located 6 mm, and 20 mm in distance to the vocal folds. |
The oscillation of the vocal folds in SimVOICE was prescribed from the experimental model as described in detail in Sadeghi et al. [50]. Thereby, the temporal evolution of the glottal duct and shape are designed based on GAW data and the experimental video footage of the silicone vocal folds during phonation as shown in Figures 8 and 7. This yields an oscillation frequency of f0 = 148 Hz and a glottal diameter ranging from 0.2 mm during glottis closure to 4.6 mm at maximum glottis opening. The motion pattern shows the typical mucosal wave-like motion [1] with a convergent-to-divergent shape change of the glottal duct and forms elliptically shaped glottis. Computationally, the resulting 3D motion is realized by the overset method which combines a fixed background mesh and a much smaller deformable overset mesh around the vocal folds controlled by the Arbitrary-Lagrangian–Eulerien (ALE) method as proposed by [56–58].
At all walls of the simVOICE model, no-slip and no-injection boundary conditions were applied. The walls of the moving vocal folds were defined as moving wall boundaries. The flow was driven by a constant pressure difference of ΔP = 3251 Pa between inlet and outlet being in the physiologic range of human lunge pressures during normal phonation [1, 8, 19].
The working fluid air was used with a kinematic viscosity of air of  and the density of air constant at
  . As the Mach number yields Ma < 0.3 [8], the fluid was considered as incompressible.
3.1.2 Turbulence modeling
Based on the results presented in [19, 50], the maximum Reynolds number amounts Re ≈ 10,000. Thus, Large Eddy Simulations (LES) in combination with a Wall-Adapting Local Eddy-Viscosity (WALE) subgrid-scale model [59] have been performed to handle turbulence. By this approach, the large-scale turbulent structures are conserved with regard to their contribution to aeroacoustic sound generation.
Due to the decoupling of the momentum equations and the continuity equation, the pressure-correction PISO algorithm (Pressure-Implicit with Splitting Operators) was applied. For solving the resulting algebraic system of equations, an Algebraic MultiGrid (AMG) method with a Gauss-Seidel relaxation scheme was used.
3.1.3 Discretization and grid convergence study
The mesh consists of approx. 1.4 million hexahedral cells and was generated based on a grid study reported in [49]. The near wall regions were discretized with wall-parallel prism layers and a all-y+ model to model the boundary layer flow for fine and coarse meshes [19, 42, 49, 50, 60]. The time step size is set to 1.0 · 10−6 s, and the corresponding CFL = 5 being sufficiently small for implicit solvers [61, 62].
3.1.4 Validation based on the benchmark data
The SimVOICE model showed a good validity in comparison to experimental data as reported in [42]. Within a shorter model of the supraglottal channel, the simulated hydrodynamic pressure yielded a good validity during one oscillation cycle of the vocal folds in comparison with the experimental data as displayed in Figure 14. The corresponding relative L2 error norm range between ranged between 0.2 and 0.33 depending on the position. The fluctuations in the simulated pressure devolution at positions 1–3 originates from the location of pressure acquisition at the center line of the channel. There, large flow fluctuations produced by the glottal jet and its shear layer instabilities occur at these positions. At positions 4 and 5, those fluctuations are much smaller. In the distribution of the experimentally measured pressure, flow fluctuations are also much smaller as the pressure data were measured at the walls of the channel as depicted in Figure 4. Thereby, the pressure devolution represents the average of the three pressure sensors at the respective position.
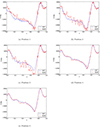 |
Figure 14 Temporal devolution of the static pressure obtained from the simulations and the measurements at positions 1–5 according to Figure 4. The measured pressure data (Exp – red) were taken from the three sensors mounted at one position of the supraglottal channel and averaged, whereas the data from the simulations (Sim – blue) were taken at the center line. (a) Position 1, (b) Position 2, (c) Position 3, (d) Position 4 and (e) Position 5. |
3.2 Aeroacoustic simulation
The aeroacoustic simulation is based upon a hybrid aeroacoustic approach as described in [55]. This approach separates the flow and acoustic computations so that acoustic sources are computed from the previously simulated flow field, resulting in a one-way coupling of the flow into the acoustic field only. A variety of formulations are available for the acoustic field calculation based on the hybrid aeroacoustic approach, among which Lighthill’s acoustic analogy [63] has been a benchmark formulation ever since. However, this approach does not distinguish between acoustic and viscous effects, and the computation of the Lighthill stress tensor can be complicated reducing the computational efficiency. Therefore, an approach utilizing a splitting technique was derived by Seo and Moon [64] resulting in a set of Perturbed Compressible Equations (PCE) based on viscous/acoustic splitting. Furthermore, Acoustic Perturbation Equations (APE) provide accurate results of the aerodynamic sound of the phonation process [65, 66].
The workflow consists of three steps, (1) perform a transient flow simulation on a restricted subdomain; (2) compute the acoustic sources from the flow field entities; (3) simulate the acoustic field. In this benchmark case, the acoustic field simulation is based on the Perturbed Convective Wave Equation (PCWE), which directly computes the acoustic field generated by low Mach number flows simulated by an incompressible CFD. A concise description of the aeroacoustic simulation framework for this benchmark case is presented in [48].
3.2.1 Aeroacoustic model
Exploiting the low Mach number flows occurring in human phonation, a computationally efficient simplification is present through the Perturbed Convective Wave Equation (PCWE), which can be achieved by reformulating the APE-2 variant of [65, 66]. Thus, the numerical effort is reduced further, because PCWE contains only one scalar unknown, the acoustic velocity potential ψa. To derive the PCWE, one starts by splitting the flow field and yields mean ( ,
,  ,
,  ) and fluctuating parts, the last of which are further separated into incompressible flow (pic, vic) and acoustic (pa, va, ρa) components. Therewith, we arrive at the PCWE for static meshes in accordance to [48, 67]
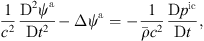 (1)with substantial derivative is given as
  . Considering that in human phonation only low Mach number flows occur [55], the substantial derivative in equation (1) can be approximated by the partial derivative with respect to time, because the convective part of the substantial derivative is localized around the VFs and insignificant in the acoustic far-field [55].
The incompressible fluid density and the speed of sound are given by  kg/m3 and c = 346.2 m/s, respectively [55]. The PCWE is solved for ψa by the finite element method using the software openCFS [68]. Using the relations
 (2)the acoustic pressure pa and the acoustic particle velocity va can be calculated from the acoustic potential ψa.
3.2.2 Geometric dimensions
Figure 15 shows the simulation domain with the larynx, vocal tract, and propagation regions. The separated description of these components is a consequence of the hybrid aeroacoustic workflow, where the aerodynamic domain, which contains the aeroacoustic sources, is formed by the larynx in conjunction with the vocal tract. The vocal tract is modeled with sound hard walls, which is justified by a sufficiently high acoustic impedance jump between air and tissue. The propagation domain is simulated with a rectangular box at the end of the vocal tract, surrounded by a Perfectly Matched Layer (PML) region ensuring free field radiation without reflection [69]. To match the experimental setup, the bottom of the propagation region is modeled sound hard. A non-conforming interface (Type Nitsche) connects the vocal tract outlet with the propagation region [55]. The subglottal inlet boundary is modeled by an Absorbing Boundary Condition (ABC), which is justified by assuming plane wave condition inside the inlet channel.
 |
Figure 15 Side view of the 3D geometry and domain of the CAA model of simVoice as introduced by [55]. Mic.1 and Mic.2 are located 5 and 8 cm in distance of the vocal tract exit (mouth). |
Different meshes are used for the flow (CFD) and acoustic (CA) simulations. To interpolate between the meshes, a conservative cut-volume-cell approach is used as defined in [52, 55].
3.2.3 Source terms of the wave equation
The aeroacoustic source term as defined in equation (1) consists of the partial time derivative of the incompressible flow pressure and a convective source term. It has a dependence on space and time, or equivalently, on space and frequency.
In [54] an in-depth analysis of the generated acoustic sources in time and frequency domain for a simulation setup similar to benchmark case 2 is given. This form of analysis gives insight in the fundamental sound-generating mechanisms and distribution in space and over the investigated time respectively frequency range. It was found that the convective part of the right-hand side in equation (1) is localized around the VFs and is negligible for prediction of the acoustic far-field due to its small integral contribution [54].
In Figure 16, we see the spatial distribution of the Fourier transformed source term  at a characteristic frequency f = f0 = 148. At this frequency f = f0, the source term reaches far into the vocal tract, as observed by the experimental data presented in [44]. The sources are filtered according to [53].


3.2.4 Discretization and mesh convergence
Table 2 shows a summary of the discretization. For the larynx region, a mesh consisting of tetrahedral elements is used to approximate the continuous geometry by 195,000 elements with a maximum element size of 2.4. The acoustic mesh inside the glottal region has a characteristic length similar to the CFD mesh. To obtain the characteristic acoustic element length Δla, the simple estimation formula by [70, 71] is used to minimize numerical dissipation and dispersion, such that
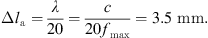 (3)
(3)
Therewith, the maximum frequency of fmax = 5 kHz is represented with 20 linear finite elements per acoustic wave length λ. The supraglottal regions, i.e. the simple vocal tract and the propagation domain in conjunction with the PML regions are meshed with hexahedron elements. As listed in Table 2, the total number of finite elements sums up to 281,500. Finally, the convergence of the discretization and the possible model speed-up was investigated in [55] based on a structured mesh study.
3.2.5 Validation procedure
To validate the acoustic simulation, experimental sound data described in this article was used.
The experimental measurements and the simulation results differ with respect to their sampling frequency and duration. The measurements have a duration of 60 s with a sampling frequency of fs = 44.1 kHz (thus 2,646,000 samples), whereas the simulation results have a sampling frequency of fs = 100 kHz and a signal length of 0.13501 s (thus 13,501 samples). The Amplitude Spectral Density (ASD), which is the square root of the Power Spectral Density (PSD), is used to compare the acoustic spectra. For the measurements, the ASD is calculated using Welch’s method [72], for which the signal is buffered into segments with a size of 20,000 samples each and an overlap of 50. A Hamming window is applied to the segments and the final spectrum is achieved by averaging over the segments [55]. The measurement ASD is illustrated by the blue line in Figure 17. The ASD of the simulation is obtained by calculating the ASD for the whole Hamming-windowed signal without segmentation. The simulation ASD is displayed as the yellow line in Figure 17. Due to the duration disparity between measurements and simulation, the tonal components of the spectra are wider for the simulation, especially towards low frequencies. In [54], resolution of the experimental data was sacrificed by shortening the window length to the simulation time, which shows a good agreement of the low frequency range tonal components of the simulation data with the experimental data.
3.2.6 Results
Source terms: Based on a source term analysis of the PCWE, the following conclusions are drawn:
Firstly, the time derivative part of the PCWE (Eq. (1)) has a larger impact on the acoustic spectrum than the convective source term part, as observed by the experimental data presented in [44]. Therefore, neglecting the time derivative part results in a low SPL that further decreases for increasing frequencies [54].
Secondly, the location of acoustic sources regarding the local pressure time derivative is frequency-dependent. For the fundamental frequency and low harmonics thereof, the acoustic sources are found in the supraglottal area. In contrast to that, for higher harmonics and non-harmonic frequencies, the acoustic sources are predominantly located in areas of high fluid velocity [44], i.e. inside the glottal jet and areas of turbulent structures [54].
Thirdly, the authors of [54] reported a connection between the glottal jet and the time instance regarding the Glottal Area Waveform (GAW). At the glottal opening instant, a new glottal jet is formed, which continues to develop until the glottis is fully opened. During the following glottal closing phase, the glottal jet is increasingly disrupted, which leads to diffusion of the jet. The decelerating fluid causes strong fluctuations. If the VFs are fully closed, the flow is cut off (zero flow driving energy), and thus the vortices are decaying in a resting fluid due. This results in a curling flow for the fully closed VFs [54].
Sound propagation: The results for sound propagation are obtained by evaluating theacoustic pressure pa at the positions Mic1 and Mic2, as depicted in Figure 15.
Figure 17 shows, that the fundamental frequency f0, which is the oscillation frequency of the vocal folds, and its harmonics are well-developed for both measurement and simulation. However, the simulation underestimates the amplitude of the fundamental frequency, which can partly be explained by the short simulation time. Overall, the transfer function characteristics from the aeroacoustic sources inside the larynx to the microphone position are represented by the simulation, except for strong sound radiation reduction around 1 kHz. Furthermore, the simulation overestimates the ASD for frequencies in the range of 3.5–5 kHz [55].
4 Conclusions
The human phonation process is characterized by a fully coupled fluid-structure-acoustic interaction which made it a prominent research object for computational and experimental engineers since the mid of the last century. As a consequence, a plurality of experimental models of the vocal folds has been developed to study the fluid flow, their vibrations and in recent times the aeroacoustic sound generation. In this work, we present the experimental larynx model synthVOICE that has been developed since 2009 which includes the internationally established M5 model of the vocal folds. The models made of silicone show flow-induced periodical vibrations and were used to analyze physiological as well as pathological phonation characteristics.
The experimental model was taken as a basis to develop the hybrid computational aeroacoustic SimVOICE model. Based on the simulated flow field data, the aeroacoustic sources were determined based on the PCWE formulation and the sound propagation was simulated with finite-element solver openCFS. The model shows a high validity of both the fluid dynamics and the acoustics. Furthermore, it has been applied to simulate physiological and pathological phonation cases to identify the basic effects of aeroacoustic sound production.
Thus, we provide the experimental data of synthVOICE for computational researcher groups in the field of aeroacoustics to evaluate their solvers with regard to accuracy and efficiency. The experimental data comprises:
Geometry of the model.
Material characteristics of the synthetic vocal folds.
Vibration characteristics: Fundamental frequency, high-speed visualization of the vocal fold dynamics glottal area waveform.
Flow field quantities: Static pressure in sub- and supraglottal channel at 40 measuring points and 2D flow velocity distribution in the mid-coronal plane.
Acoustic field: Produced sound measured by four microphones in the far field of the model.
Additionally to the experimental data, the simulated flow and sound field data are also provided to give the opportunity to reproduce the separate steps of an aeroacoustic simulation. All data are free of charge.
Acknowledgments
The computational results presented have been achieved in part using the Vienna Scientific Cluster (VSC). Supported by TU Graz Open Access Publishing Fund.
Conflict of interest
The authors declared no conflict of interest.
Data availability statement
The extensive data packages, including the geometry, the material characteristics, quantities of the vocal fold dynamics, fluid mechanical quantities and the acoustic field is available in Zenodo, under the reference [73].
References
- I.R. Titze: Principles of voice production. 2nd ed., National Center for Voice and Speech, Denver, 2000. [Google Scholar]
- I.R. Titze: The myoelastic aerodynamic theory of phonation. National Center for Voice and Speech, Denver, 2006. [Google Scholar]
- J. Wendler, W. Seidner, U. Eysholdt: Lehrbuch der phoniatrie und pädaudiologie. 4th ed., Thieme, Stuttgart, 2005. [Google Scholar]
- S. Kniesburges, A. Lodermeyer, S. Becker, M. Traxdorf, M. Döllinger: The mechanisms of subharmonic tone generation in a synthetic larynx model. Journal of the Acoustical Society of America 139, 6 (2016) 3182–3192. [CrossRef] [PubMed] [Google Scholar]
- G.E. Peterson, H.L. Barney: Control methods used in a study of the vowels. Journal of the Acoustical Society of America 24 (1952) 175–184. [CrossRef] [Google Scholar]
- J. van den Berg, J.T. Zantema, P. Doornenbal: On the air resistance and the Bernoulli effect of the human larynx. Journal of the Acoustical Society of America 29 (1957) 626–631. [CrossRef] [Google Scholar]
- F. Alipour, C. Brücker, D.D. Cook, A. Gömmel, M. Kaltenbacher, W. Mattheus, L. Mongeau, E. Nauman, R. Schwarze, I. Tokuda, S. Zörner: Mathematical models and numerical schemes for the simulation of human phonation. Current Bioinformatics 6, 3 (2011) 323–343. [CrossRef] [Google Scholar]
- S. Kniesburges, S. L. Thomson, A. Barney, M. Triep, P. Šidlof, J. Horáčcek, C. Brücker, S. Becker: In vitro experimental investigation of voice production. Current Bioinformatics 6, 3 (2011) 305–322. [CrossRef] [PubMed] [Google Scholar]
- R. Mittal, B.D. Erath, M.W. Plesniak: Fluid dynamics of human phonation and speech. Annual Review of Fluid Mechanics 45 (2013) 437–467. [CrossRef] [Google Scholar]
- Z. Zhang: Mechanics of human voice production and control. Journal of the Acoustical Society of America 140, 4 (2016) 2614–2635. [CrossRef] [PubMed] [Google Scholar]
- R.C. Scherer, D. Shinwari, K.J. De Witt, C. Zhang, B.R. Kucinschi, A.A. Afjeh: Intraglottal pressure profiles for a symmetric and oblique glottis with a divergence angle of 10 degrees. Journal of the Acoustical Society of America 109, 4 (2001) 1616–1630. [CrossRef] [PubMed] [Google Scholar]
- D.A. Berry, Z. Zhang, J. Neubauer: Mechanisms of irregular vibration in a physical model of the vocal folds. Journal of the Acoustical Society of America 120, 3 (2006) EL36–EL42. [CrossRef] [PubMed] [Google Scholar]
- S. Kniesburges, A. Lodermeyer, M. Semmler, Y.K. Schulz, A. Schützenberger, S. Becker: Analysis of the tonal sound generation during phonation with and without glottis closure. Journal of the Acoustical Society of America 147, 5 (2020) 3285–3293. [CrossRef] [PubMed] [Google Scholar]
- A. Lodermeyer, M. Tautz, S. Becker, M. Döllinger, V. Birk, S. Kniesburges: Aeroacoustic analysis of the human phonation process based on a hybrid acoustic PIV approach. Experiments in Fluids 59 (2018) 13. [CrossRef] [Google Scholar]
- J. Neubauer, Z. Zhang, R. Miraghaie, D.A. Berry: Coherent structures of the near field flow in a self-oscillating physical model of the vocal folds. Journal of the Acoustical Society of America 121, 2 (2007) 1102–1118. [CrossRef] [PubMed] [Google Scholar]
- S.L. Smith, S.L. Thomson: Effect of inferior surface angle on the self-oscillation of a computational vocal fold model. Journal of the Acoustical Society of America 131, 5 (2012) 4062–4075. [CrossRef] [PubMed] [Google Scholar]
- S.L. Thomson, L. Mongeau, S.H. Frankel: Aerodynamic transfer of energy to the vocal folds. Journal of the Acoustical Society of America 118, 3 (2005) 1689–1700. [CrossRef] [PubMed] [Google Scholar]
- Z. Zhang: Vibration in a self-oscillating vocal fold model with leftright asymmetry in body-layer stiffness. Journal of the Acoustical Society of America 128, 5 (2010) 279–285. [Google Scholar]
- S. Falk, S. Kniesburges, S. Schoder, B. Jakubaß, P. Maurerlehner, M. Echternach, M. Kaltenbacher, M. Döllinger, 3D-FV-FE aeroacoustic larynx model for investigation of functional based voice disorders. Frontiers in Physiology 12 (2021) 226. [CrossRef] [Google Scholar]
- M.H. Farahani, J. Mousel, F. Alipour, S. Vigmostad: A numerical and experimental investigation of the effect of false vocal fold geometry on glottal flow. Journal of Biomechanical Engineering 135, 12 (2013) 1210061. [CrossRef] [Google Scholar]
- M. Mihaescu, S.M. Khosla, S. Murugappan, E.J. Gutmark: Vortex dipolar structures in a rigid model of the larynx at flow onset. Journal of the Acoustical Society of America 127, 1 (2010) 435–444. [CrossRef] [PubMed] [Google Scholar]
- P. Šidlof, S. Zörner, A. Hüppe: A hybrid approach to the computational aeroacoustics of human voice production. Biomechanics and Modeling in Mechanobiology 14 (2015) 473–488. [CrossRef] [PubMed] [Google Scholar]
- M. Döllinger, J. Kobler, D.A. Berry, D.D. Mehta, G. Luegmair, C. Bohr: Experiments on analysing voice production: Excised (human, animal) and in vivo (animal) approaches. Current Bioinformatics 6, 3 (2011) 286–304. [CrossRef] [PubMed] [Google Scholar]
- S. Kniesburges, V. Birk, A. Lodermeyer, A. Schützenberger, C. Bohr, S. Becker: Effect of the ventricular folds in a synthetic larynx model. Journal of Biomechanics 55 (2017) 128–133. [CrossRef] [PubMed] [Google Scholar]
- N. Ruty, L. Bailly, X. Pelorson, N. Henrich: Influence of a constriction in the near field of the vocal folds: Physical modeling and experimental validation. Journal of the Acoustical Society of America 128, 5 (2008) 3296–3308. [Google Scholar]
- M. Motie-Shirazi, M. Zanartu, S.D. Peterson, B.D. Erath: Vocal fold dynamics in a synthetic self-oscillating model: Intraglottal aerodynamic pressure and energy. Journal of the Acoustical Society of America 150, 2 (2021) 1332–1345. [CrossRef] [PubMed] [Google Scholar]
- D. Bodaghi, Q. Xue, X. Zheng, S. Thomson: Effect of subglottic stenosis on vocal fold vibration and voice production using fluid–structure–acoustics interaction simulation. Applied Sciences 11, 3 (2021) 1221. [CrossRef] [Google Scholar]
- B.A. Hilton, S.L. Thomson: Aerodynamic-induced effects of artificial subglottic stenosis on vocal fold model phonatory response. Journal of Voice (2022). [Google Scholar]
- M. Motie-Shirazi, M. Zanartu, S.D. Peterson, D.D. Mehta, J.B. Kobler, R.E. Hillman, B.D. Erath: Toward development of a vocal fold contact pressure probe: Sensor characterization and validation using synthetic vocal fold models. Applied Science 9, 3 (2019) 3002. [CrossRef] [Google Scholar]
- R. Veltrup, S. Kniesburges, M. Semmler: Influence of perspective distortion in laryngoscopy. Journal of Speech, Language, and Hearing Research 66, 9 (2023) 3276–3289. [CrossRef] [PubMed] [Google Scholar]
- S. Weiß, S.L. Thomson, R. Lerch, M. Döllinger, A. Sutor: Pipette aspiration applied to the characterization of nonhomogeneous, transversely isotropic materials used for vocal fold modeling. Journal of the Mechanical Behavior of Biomedical Materials 17 (2013) 137–151. [CrossRef] [PubMed] [Google Scholar]
- M. Döllinger, Z. Zhang, S. Schoder, P. Šidlof, B. Tur, S. Kniesburges: Overview on state-of-the-art numerical modeling of the phonation process. Acta Acustica 7 (2023) 25. [CrossRef] [EDP Sciences] [Google Scholar]
- F. Durst, U. Heim, B. Ünsal, G. Kullik: Mass flow rate control system for time-dependent laminar and turbulent flow investigations. Measurement Science and Technology 14 (2003) 893–903. [CrossRef] [Google Scholar]
- T.D. Rossing: Handbook of acoustics. Springer, New York, 2007. [CrossRef] [Google Scholar]
- Z. Zhang, J. Neubauer, D.A. Berry: Aerodynamically and acoustically driven modes of vibration in a physical model of the vocal folds. Journal of the Acoustical Society of America 120, 5 PT 1 (2006) 2841–2849. [CrossRef] [PubMed] [Google Scholar]
- Z. Zhang, J. Neubauer, D.A. Berry: The influence of subglottal acoustics on laboratory models of phonation. Journal of the Acoustical Society of America 120, 3 (2006) 1558–1569. [CrossRef] [PubMed] [Google Scholar]
- S.L. Thomson, L. Mongeau, F.H. Frankel: Physical and numerical flow-excited vocal fold model. In: C. Manfredi (Ed.) Proceedings of the 3rd International Workshop MAVEBA, 2003, pp. 147–150. [Google Scholar]
- S. Kniesburges: Fluid-structure-acoustic interaction during phonation in a synthetic larynx model. PhD thesis, FAU Erlangen-Nürnberg, Düren, 2014. [Google Scholar]
- S. Kniesburges, C. Hesselmann, S. Becker, E. Schlücker, M. Döllinger: Influence of vortical flow structures on the glottal jet location in the supraglottal region. Journal of Voice 272, 5 (2013) 531–544. [CrossRef] [PubMed] [Google Scholar]
- A. Lodermeyer, E. Bagheri, S. Kniesburges, C. Näger, J. Probst, M. Döllinger, S. Becker: The mechanisms of harmonic sound generation during phonation: A multi-modal measurement-based approach. Journal of the Acoustical Society of America 150, 5 (2021) 3485–3499. [CrossRef] [PubMed] [Google Scholar]
- A. Kist, P. Gomez, D. Dubrovskiy, P. Schlegel, M. Kunduk, M. Echternach, R. Patel, M. Semmler, C. Bohr, S. Dürr, A. Schützenberger, M. Döllinger: A deep learning enhanced novel software tool for laryngeal dynamics analysis. Journal of Speech, Language, and Hearing Research 64, 6 (2021) 1889–1903. [CrossRef] [PubMed] [Google Scholar]
- H. Sadeghi, S. Kniesburges, S. Falk, M. Kaltenbacher, A. Schützenberger, M. Döllinger: Towards a clinically applicable computational larynx model. Applied Sciences 9, 11 (2019) 2288. [CrossRef] [Google Scholar]
- R.J. Adrian, J. Westerweel: Particle image velocimetry. Cambridge University Press, Cambridge, 2011. [Google Scholar]
- A. Lodermeyer: A laser-based technique to evaluate sound generation during phonation. PhD thesis, FAU Erlangen-Nürnberg, Erlangen, 2020. [Google Scholar]
- L. Cavalli, A. Hirson: Diplophonia reappraised. Journal of Voice 13, 4 (1999) 542–556. [CrossRef] [PubMed] [Google Scholar]
- R. de Kat, B. van Oudheusden: Instantaneous planar pressure determination from PIV in turbulent flow. Experiments in Fluids 52 (2012) 1089–1106. [CrossRef] [Google Scholar]
- X. Liu, J. Katz: Instantaneous pressure and material acceleration measurements using a four-exposure PIV system. Experiments in Fluids 41 (2006) 227–240. [CrossRef] [Google Scholar]
- P. Maurerlehner, S. Schoder, C. Freidhager, A. Wurzinger, A. Hauser, F. Kraxberger, S. Falk, S. Kniesburges, M. Echternach, M. Döllinger, M. Kaltenbacher: simVoice – a three-dimensional simulation model based on a hybrid aeroacoustic approach. e & i Elektrotechnik und Informationstechnik 138 (2021) 219–228. [CrossRef] [Google Scholar]
- H. Sadeghi, M. Döllinger, M. Kaltenbacher, S. Kniesburges: Aerodynamic impact of the ventricular folds in computational larynx models. Journal of the Acoustical Society of America 145, 4 (2019) 2376–2387. [CrossRef] [PubMed] [Google Scholar]
- H. Sadeghi, S. Kniesburges, M. Kaltenbacher, A. Schützenberger, M. Döllinger: Computational models of laryngeal aerodynamics: Potentials and numerical costs. Journal of Voice 33, 4 (2019) 385–400. [CrossRef] [PubMed] [Google Scholar]
- S. Schoder, A. Hauser, P. Maurerlehner, S. Falk, S. Kniesburges, M. Doellinger, M. Kaltenbacher: simVoice – Efficient acoustic propagation model of the human voice source using finite element method. In: N.H. Bernardoni, L. Bailly (Eds.), Proceedings of the 12th International Conference on Voice Physiology and Biomechanics, Grenoble, France, March 2020. [Google Scholar]
- S. Schoder, M. Kaltenbacher: Hybrid aeroacoustic computations: State of art and new achievements. Journal of Theoretical and Computational Acoustics 27, 04 (2019) 1950020. [Google Scholar]
- S. Schoder, F. Kraxberger, S. Falk, A. Wurzinger, K. Roppert, S. Kniesburges, M. Döllinger, M. Kaltenbacher: Error detection and filtering of incompressible flow simulations for aeroacoustic predictions of human voice. Journal of the Acoustical Society of America 152, 3 (2022) 1425–1436. [CrossRef] [PubMed] [Google Scholar]
- S. Schoder, P. Maurerlehner, A. Wurzinger, A. Hauser, S. Falk, S. Kniesburges, M. Döllinger, M. Kaltenbacher: Aeroacoustic sound source characterization of the human voice production-perturbed convective wave equation. Applied Sciences 11, 6 (2021) 2614. [CrossRef] [Google Scholar]
- S. Schoder, M. Weitz, P. Maurerlehner, A. Hauser, S. Falk, S. Kniesburges, M. Döllinger, M. Kaltenbacher, Hybrid aeroacoustic approach for the efficient numerical simulation of human phonation. Journal of the Acoustical Society of America 147, 2 (2020) 1179–1194. [CrossRef] [PubMed] [Google Scholar]
- J. Donea, A. Huerta, J.-Ph. Ponthot, A. Rodriguez-Ferran: Arbitrary Lagrangian–Eulerian Methods, Vol. 1. John Wiley & Sons Ltd, 2004, pp. 414–437. [Google Scholar]
- M. Feistauer, P. Sváček, J. Horáček: Numerical simulation of fluid-structure interaction problems with applications to flow in vocal folds. Springer Basel, Basel, 2014, pp. 321–393. [Google Scholar]
- H. Hadzic: Development and application of a finite volume method for the computation of flows around moving bodies on unstructured, overlapping grids. PhD thesis. TU Hamburg, Hamburg, 2005. [Google Scholar]
- F. Nicoud, F. Ducros: Subgrid-scale stress modelling based on the square of the velocity gradient tensor. Flow, Turbulence and Combustion 62, 3 (1999) 193–200. [Google Scholar]
- H. Reichardt: Vollständige darstellung der turbulenten geschwindigkeitsverteilung in glatten leitungen, Zeitschrift für Angewandte Mathematik und Mechanik 31, 7 (1951) 208–219. [CrossRef] [Google Scholar]
- J.D. Anderson: Computational fluid dynamics. 3rd ed., McGraw-Hill, Berlin, 1995. [Google Scholar]
- C. Hirsch: Numerical computation of internal and external flows: The fundamentals of computational fluid dynamics. Elsevier, Oxford, 2007. [Google Scholar]
- M.J. Lighthill: On sound generated aerodynamically. I. General theory. Proceedings of the Royal Society of London. Series A. Mathematical and Physical Sciences 211, 1107 (1952) 564–587. [Google Scholar]
- J.-H. Seo, Y.J. Moon: Perturbed compressible equations for aeroacoustic noise prediction at low mach numbers. AIAA Journal 43, 8 (2005) 1716–1724. [CrossRef] [Google Scholar]
- A. Hüppe, M. Kaltenbacher: Comparison of source term formulations for computational aeroacoustics. In: 19th AIAA/CEAS Aeroacoustics Conference, Berlin, 2013. [Google Scholar]
- S. Zörner, P. Šidlof, A. Hüppe, M. Kaltenbacher: Flow and acoustic effects in the larynx for varying geometries. Acta Acustica United with Acustica 102, 2 (2016) 257–267. [CrossRef] [Google Scholar]
- M. Kaltenbacher (Ed.), Computational acoustics. Springer, CISM International Centre for Mechanical Sciences, 2017. [Google Scholar]
- S. Schoder, K. Roppert: openCFS: Open source finite element software for coupled field simulation–part acoustics (2022). ArXiv preprint available at https://doi.org/10.48550/arXiv.2207.04443. [Google Scholar]
- B. Kaltenbacher, M. Kaltenbacher, I. Sim: A modified and stable version of a perfectly matched layer technique for the 3-d second order wave equation in time domain with an application to aeroacoustics. Journal of Computational Physics 235 (2013) 407–422. [CrossRef] [PubMed] [Google Scholar]
- M. Ainsworth: Discrete dispersion relation for hp-version finite element approximation at high wave number. SIAM Journal on Numerical Analysis 42, 2 (2004) 553–575. [CrossRef] [Google Scholar]
- M. Kaltenbacher: Numerical simulation of mechatronic sensors and actuators: Finite elements for computational multiphysics. 3rd ed., Springer, Berlin-Heidelberg, 2015. [Google Scholar]
- P. Welch: The use of fast fourier transform for the estimation of power spectra: A method based on time averaging over short, modified periodograms. IEEE Transactions on Audio and Electroacoustics 15, 2 (1967) 70–73. [CrossRef] [Google Scholar]
- S. Kniesburges, S. Schoder: FSAI-01: A benchmark case for aeroacoustic simulations involving fluid-structure-acoustic interaction transferred from the process of human phonation, Zenodo 1 (2023) 1–2. https://doi.org/10.5281/zenodo.10402984. [Google Scholar]
Cite this article as: Schoder S. Falk S. Wurzinger A. Lodermeyer A. Becker S, et al. 2024. A benchmark case for aeroacoustic simulations involving fluid-structure-acoustic intraction transferred from the process of human phonation. Acta Acustica, 8, 13.
All Tables
All Figures
|
Figure 1 Schematic pictures of a) a human head in a sagittal cut and b) the larynx in a coronal cut, showing the Vocal Folds (VF) and the Ventricular Folds (VeF). |
| In the text | |
|
Figure 2 Synthetic larynx model with massflow generator, silencer, subglottal channel and silicone vocal fold models. |
| In the text | |
|
Figure 3 Geometrical dimension of the M5 vocal fold model and the ventricular fold model. |
| In the text | |
|
Figure 4 Synthetic larynx model and supraglottal channel with optional Ventricular Folds (VeF), subglottal and 39 supraglottal pressure sensors. |
| In the text | |
|
Figure 5 Schematic picture and photo of the experimental setup for the high-speed visualization of the vocal folds vibration. |
| In the text | |
|
Figure 6 Schematic picture of the experimental setup for the 2D flow field measurement with High-Speed Particle-Image-Velocimetry. The laser light sheet was guided in the supraglottal channel in the mid-coronal plane. The motion of the tracer particles was recorded within the Region Of Interest (ROI) indicated in red. |
| In the text | |
|
Figure 7 Pictures of the vocal folds from a superior perspective for one oscillation cycle indicated by the phase angle φ = 0 − 2π. Top row: Oscillation of the model without ventricular folds. Bottom row: Model with the ventricular folds. |
| In the text | |
|
Figure 8 Glottal area (solid black) and subglottal pressure waveform (solid red) for one oscillation cycle (φ = 0 − 2π) with characteristic point specified. |
| In the text | |
|
Figure 9 Amplitude Spectral Density of the subglottal pressure with and without VeFs. |
| In the text | |
|
Figure 10 Amplitude spectral density of the supraglottal pressure at five positions according to Figure 4. (a) Supraglottal channel case without VeFs, (b) Supraglottal channel case with VeFs. |
| In the text | |
|
Figure 11 Resulting flow fields from the time-resolved PIV measurements at different phase angles representing different instances within an oscillation cycle. The left column depicts the velocity magnitude with the vocal fold structure in white. Additionally, vectors indicate the direction of the flow. The right column shows contour plots of the relative static pressure computed from the velocity field. Thereby, the pressure is given in reference to the ambient pressure p0. |
| In the text | |
|
Figure 12 Amplitude spectral density of the generated sound for the larynx model with and without ventricular folds in the supraglottal channel analogously to Figure 4. |
| In the text | |
|
Figure 13 3D representation of simVoice, including a velocity field in the mid-coronal plane, the Vocal Folds (VF), the Ventricular Folds (VeF), and the rectangular vocal tract. Points P1, and P2 are located 6 mm, and 20 mm in distance to the vocal folds. |
| In the text | |
|
Figure 14 Temporal devolution of the static pressure obtained from the simulations and the measurements at positions 1–5 according to Figure 4. The measured pressure data (Exp – red) were taken from the three sensors mounted at one position of the supraglottal channel and averaged, whereas the data from the simulations (Sim – blue) were taken at the center line. (a) Position 1, (b) Position 2, (c) Position 3, (d) Position 4 and (e) Position 5. |
| In the text | |
|
Figure 15 Side view of the 3D geometry and domain of the CAA model of simVoice as introduced by [55]. Mic.1 and Mic.2 are located 5 and 8 cm in distance of the vocal tract exit (mouth). |
| In the text | |
 |
Figure 16 Visualization of |
| In the text | |
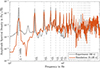 |
Figure 17 Comparison of ASD at Mic. 2 for experiment and simulation ([55], Fig. 15). |
| In the text | |
Current usage metrics show cumulative count of Article Views (full-text article views including HTML views, PDF and ePub downloads, according to the available data) and Abstracts Views on Vision4Press platform.
Data correspond to usage on the plateform after 2015. The current usage metrics is available 48-96 hours after online publication and is updated daily on week days.
Initial download of the metrics may take a while.