Figure 9
Download original image
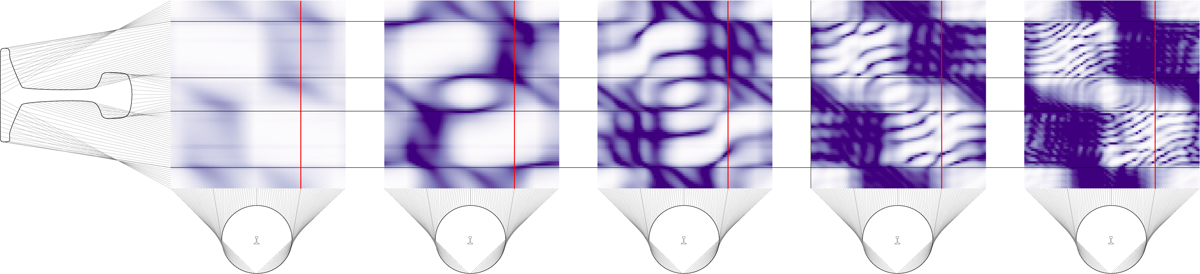
Transfer function from surface velocity on each individual node on the rail surface (vertical axis) to the sound pressure in circle with 20 m radius around the rail (horizontal axis), displayed as the relative difference to the largest contribution, in dB. Left to right: 500 Hz, 1000 Hz, 2000 Hz, 4000 Hz, and 7500 Hz. The orientation is identical to Figure 8.
Current usage metrics show cumulative count of Article Views (full-text article views including HTML views, PDF and ePub downloads, according to the available data) and Abstracts Views on Vision4Press platform.
Data correspond to usage on the plateform after 2015. The current usage metrics is available 48-96 hours after online publication and is updated daily on week days.
Initial download of the metrics may take a while.