Figure 5
Download original image
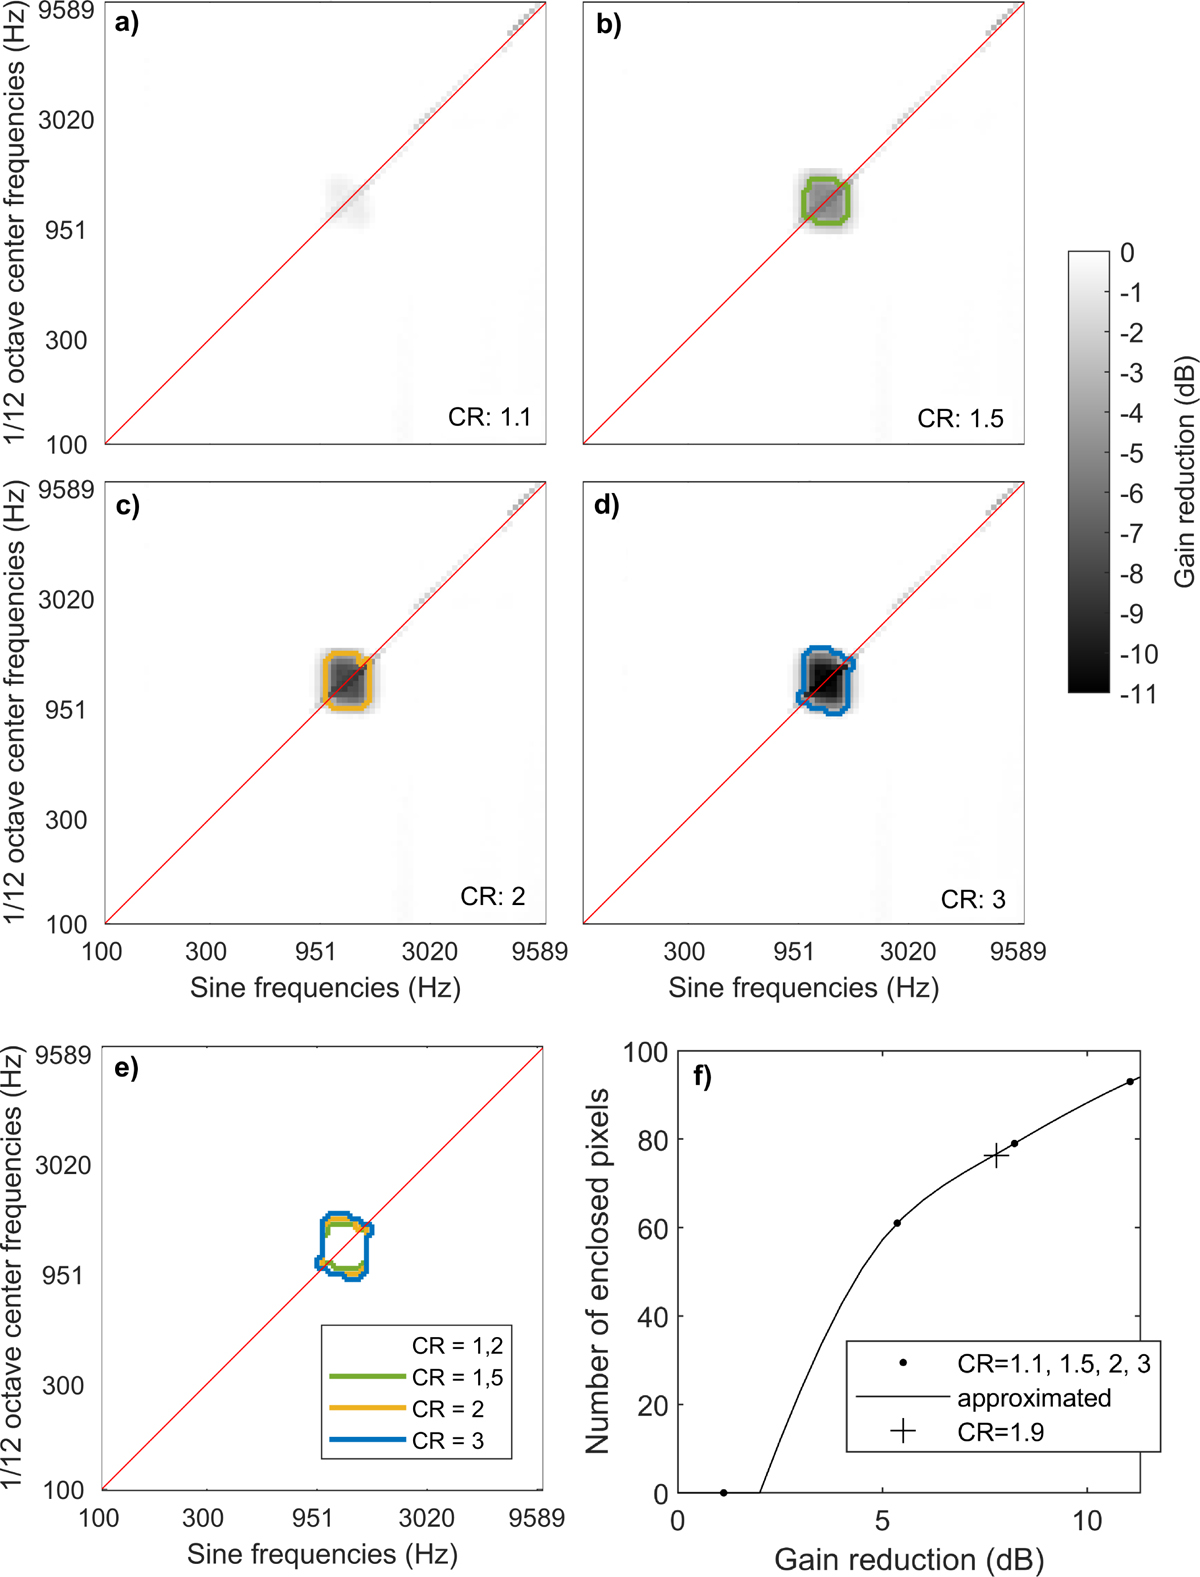
Grayscale plot and the contours detected for a channel specific compression of hearing aid channel 5 (HAC 5) of the research hearing aid (RHA). Panel (a)–(d) show the results for different compression ratios (CRs), and panel (e) depicts all contours detected within one plot. In panel (f), the number of pixels enclosed by the contours is plotted against the amount of gain reduction due to different CRs.
Current usage metrics show cumulative count of Article Views (full-text article views including HTML views, PDF and ePub downloads, according to the available data) and Abstracts Views on Vision4Press platform.
Data correspond to usage on the plateform after 2015. The current usage metrics is available 48-96 hours after online publication and is updated daily on week days.
Initial download of the metrics may take a while.