| Issue |
Acta Acust.
Volume 10, 2026
|
|
|---|---|---|
| Article Number | 9 | |
| Number of page(s) | 16 | |
| Section | Hearing, Audiology and Psychoacoustics | |
| DOI | https://doi.org/10.1051/aacus/2026002 | |
| Published online | 18 February 2026 | |
Scientific Article
Level-dependent hearing protectors can switch the perception of sound direction
1
Fraunhofer Institute for Digital Media Technology IDMT, Branch Hearing, Speech and Audio Technology HSA, Oldenburg, Germany
2
Department of Medical Physics and Acoustics, Carl von Ossietzky University of Oldenburg and Cluster of Excellence “Hearing4All”, Oldenburg, Germany
* Corresponding author: This email address is being protected from spambots. You need JavaScript enabled to view it.
Received:
26
March
2025
Accepted:
6
January
2026
Abstract
Level-dependent hearing protectors enable listeners to perceive soft to medium-level sounds, while protecting the ear against hazardous high-level signals. The impact of these devices on localization ability due to changes in interaural cues is mostly unknown. This study investigated the influence of two hearing protectors (earplug and earmuff) in passive and one active setting on localizing two common alarm signals in noise at two signal levels compared to open ears. A listening test with 16 normal-hearing participants was conducted inside a horizontal array of 48 loudspeakers. Additionally, the stimuli were recorded with an artificial head in the same setup to calculate the corresponding occurring interaural cues. The results showed that especially one of the devices under test altered the perception of target direction, even causing alarms from one side to be misperceived as coming from the opposite side of the head. The technical measurements support these findings by revealing large changes of interaural level differences with this device compared to open ears, mostly aligning with participant responses. These findings indicate the need to test electronic hearing protectors regarding altered interaural cues to avoid safety risks due to impaired localization. Moreover, measurements of these cues can help predicting the perceived sound direction by human listeners.
Key words: Localization / ILD / Interaural cues / Horizontal plane / Level-dependent hearing protection
© The Author(s), Published by EDP Sciences, 2026
 This is an Open Access article distributed under the terms of the Creative Commons Attribution License (https://creativecommons.org/licenses/by/4.0), which permits unrestricted use, distribution, and reproduction in any medium, provided the original work is properly cited.
1 Introduction
In Germany alone, four to five million workers are exposed to hazardous loud noises at their workplaces and need to prevent noise-induced hearing loss by the usage of a hearing protection device (HPD) [1]. In such environments, it is often crucial to rely on auditory situational awareness, i.e., the ability to use properties of the incoming sound to properly localize and detect them to avoid mistakes that could lead to accidents. One typical scenario that still leads to accidents is an approaching reversing vehicle (e.g., [2, 3]) which is why studying the localization ability in these scenarios, especially in the horizontal plane, is relevant. Importantly, hearing protection devices have been shown to be detrimental to correct localization and other aspects of auditory situational awareness and communication among workers (e.g., [4, 5]).
Some HPDs are equipped with microphones and internal loudspeakers to ensure audibility of soft- or medium-level sounds by damping or electronically amplifying the incoming sounds depending on the sound level, i.e., by providing a hear-through mode in which softer incoming sounds are played back at their original or even at an amplified level. With increasing level, the amplification is gradually switched off. This level-dependent behavior preserves the ability of the listeners to communicate in quiet periods while still protecting the ear against high-level sounds. Thus, these level-dependent or active HPDs act like a dynamic range compressor and manipulate the incoming sound level at both ears. Depending on the microphone positions, the effective path length between both ears may be changed compared to listening with open ears (mostly with earmuffs). Moreover, the processing times between the devices at both ears could differ (mainly with earplugs). These factors could lead to altered interaural cues, such as interaural level differences (ILDs) or interaural time differences (ITDs), which are important for sound localization.
Several listening experiments with conventional passive HPDs like earplugs, earmuffs or combinations with safety helmets have already shown that HPD usage can impair auditory localization abilities. These studies reported increases in, e.g., front-back confusions, higher localization uncertainty or fewer correct localization responses (e.g., [6–8]) and even more confusions between the left and right hemispheres [8, 9]. The earmuffs used in these studies were typically shown to be more detrimental to localization accuracy compared to open ears, while the tested earplugs often yielded similar results as unprotected ears (e.g., [7, 9]). This was supported by technical measurements of head-related transfer functions in [4, 10], which showed that earmuffs generally caused greater disruption of monaural spectral localization cues compared to earplugs. These spectral cues, which complement interaural time and level differences, are critical for vertical plane localization and resolving front-back ambiguities.
This study focused on the influence of level-dependent hearing protectors. Former studies have pointed out that these are detrimental to localization performance compared to performance with open ears as well as passive HPDs (e.g., [10–12]). Nevertheless, the results regarding advantages or disadvantages through the level-dependency were conflicting and far too little attention has been paid to the influence of level on the localization performance with these protectors. Usually, studies with such HPDs focused on the impact of various target or masker signals, or types of hearing protectors with different technologies [11–16]. Most studies used either target signals without background noise [10, 12], noise that was played back over different loudspeakers than the target signals [14, 17], or loudspeaker arrays with a relatively low resolution with angular spacing of 45° or higher [14, 17, 18]. Target signals were typically broadband noise [7, 10], gun related sounds [4, 7, 16] or reversal alarms [9, 14, 19]. Although noise signals are in general more preferable in terms of modeling, gun shots and reversal alarms would be the more realistic target signals.
Additionally, previous studies with level-dependent HPDs have rarely conducted technical measurements to gain more insight into the relationship between changes in interaural cues and localization errors. These could have explained altered perceptions of the signal directions. While research on hearing aids and other hearing devices has shown that technical acoustic measurements can predict behavioral localization performance [20, 21], similar comprehensive approaches are lacking for hearing protection. These studies on hearing devices found that design factors critically affect localization cues, e.g., microphone placement affects spectral cues important for vertical localization [22], and signal processing can alter interaural cues needed for horizontal localization [23]. A study by Brungart et al. [24] used chirp signals to analyze transfer functions of eight level-dependent HPDs with respect to different acoustic aspects relevant for spatial perception, e.g., ITDs and ILDs. They generally found altered localization cues and even an inversed ILD in one device in the frequency region below 3 kHz. Typical tonal backup alarm signals consist of tonal components between 1 and 4 kHz [25]. However, Brungart et al. [24] used pink noise stimuli for the listening test part of their study and did not investigate results for specific angles. Accordingly, the relation between the localization performance and the altered ILDs in the frequency regions of alarm signals remained unclear since further cues could have been used to localize the broadband stimuli correctly.
To the best of the authors’ knowledge, no published study reported if and how level-dependent HPD algorithms modify interaural cues at specific angles, for different signals, and for different levels. Consequently, it remains unknown how possible modifications influence localization perception. To get a better understanding of the effect of HPDs on localization performance in a realistic scenario, this study focused on the localization of reverse alarms at two different signal levels to assess the impact of the level-dependent behavior, all performed in the presence of spatially distributed background noise. For this purpose, two experiments were conducted. First, a listening test with a sound localization task and, second, a technical measurement with an artificial head. The following research questions were addressed: (1) Do level-dependent hearing protectors impair localization performance more than passive HPDs? (2) Does the performance depend on the incoming sound level and signal type? (3) Do the HPDs change interaural cues in ways that can be measured technically, and can these explain the behavioral responses from the participants in the localization task?
2 Material and methods
The study consisted of two parts: a listening experiment and technical measurements with an artificial head. Both were conducted with the same setup, HPDs, and stimuli. In the main listening tests, participants listened to one of two alarm signals presented from a random position in the horizontal plane and were required to adjust an LED on a stripe above the loudspeakers to the position where they judged the sound to emerge from. These tests were conducted with hearing protection in background noise and with open ears in quiet as well as background noise.
2.1 Participants
Sixteen (7 male, 9 female) normal-hearing participants aged 19 to 27 years (mean: 24.1 years) volunteered to take part in the experiment. They were paid on an hourly basis and gave written consent for the experiment and data handling. To assess their hearing status, they had to fill out a questionnaire and do an audiometry-like test using the Single-Interval-1-Up-1-Down (SIUD) procedure by Lecluyse and Meddis [26] for frequencies of 1000, 500, 250 and 125 Hz in this respective order. The SIUD procedure was done using sound-field testing with pure tones played back from a frontal loudspeaker.
The participants were considered to have normal hearing if they passed the questionnaire and if their detection threshold was smaller than 25 dB HL at each tested frequency. The mean threshold of all participants at each frequency was between 13 and 16 dB HL (mean: 14.6 dB HL) with a standard deviation of 4.8 to 6.5 dB (mean: 5.6 dB). The questionnaire was used to ask about any known hearing disorders, tinnitus, the extent of their exposure to noisy environments in the past year, and severe ear diseases in the past. Since the answers and hearing thresholds were inconspicuous, no participants had to be excluded. The experiment was approved by the ethics committee of the University of Oldenburg (Drs.EK/2019/073-04 and Drs.EK/2019/073-02).
2.2 Experimental setup
Both parts of the study took place in a free-field room that was anechoic down to 200 Hz. The clear working area was 7.5 × 4.0 × 6.0 m3 and the noise level in quiet was 18 dB(A). The participants and the artificial head were placed on a chair on a platform in the middle of the room. The chair was surrounded by a horizontal loudspeaker array at 2 m distance and 1.8 m height from the floor, consisting of 48 visible loudspeakers of type 8030B by Genelec in 360° with an angular spacing of 7.5°. It was possible to turn around with the chair in any azimuthal direction and to adjust the height which was used to align the ear level of the participants and the artificial head with the loudspeaker array. The loudspeakers were connected to D.O.Tec 32 channel MADI DA converters and these to an RME MADIface XT audio interface which got its signals from a PC running Matlab. This experimenter’s PC and equipment, except the loudspeakers, were placed in a room adjacent to the anechoic room. A talkback microphone and loudspeaker ensured communication between participant and experimenter.
For the listening test, an additional remote control with a rotary knob and a keyboard for entering the participants’ responses were used and connected to the PC via USB. Other keys on the remote control had no functionality. An LED stripe with a resolution of 0.38° located above the loudspeakers all around the participant was utilized to indicate the direction that participants adjusted on the rotary knob. It was driven by an Arduino Mega 2560 and controlled by Matlab. A counterclockwise rotation of the rotary knob led to a jump of an LED on the stripe to the left and vice versa. Additionally, the rotary knob could be pressed to record responses from the participants.
A HEAD acoustics HMS II.3 with torso simulator was mounted on the chair for the technical measurements. A GRAS 12AQ with linear input was used as additional amplifier for the microphone-signals from both ears. The system was calibrated with a GRAS 42AG multifunction sound calibrator at 1 kHz at 94 dB.
2.3 Test signals
Two typical alarm signals that may be used in occupational situations were selected as target signals: a conventional tonal alarm and a multi-tone as recommended by Laroche [27]. The tonal alarm was based on the alarm used in [19] with a main frequency component at 1250 Hz and harmonics at 2500, 3750, 5000, 6350, 7500 and 8750 Hz which were at least 30 dB weaker in level than the main component. The multi-tone alarm consisted of three equally loud components at 1000, 1150, and 1300 Hz (see Fig. 1). The tonal alarm had a length of 500 ms and the multi-tone of 400 ms as also used in [19, 27], respectively. Both alarms were always presented only once and not repeated. This reflects a worst-case scenario in which participants would need to be able to respond upon the first presentation of the alarm signal.
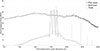 |
Figure 1. A-weighted sound pressure level of the target signals and overall background noise calculated using Welch’s power spectral density estimate with Hamming windows of length 2048 samples, an overlap of 1024 samples and 2048 discrete Fourier transform points. |
A 1 s long pink noise was used as masker, because this type of noise is often used in localization studies. To ensure a steady state of the HPDs’ audio processing for level-dependency, the target signals started 300 ms after the noise onset and were hence nearly temporally centered in the noise. The same noise token was used in all 48 loudspeakers and regenerated for every trial. All signals were windowed with a Hann window with a ramp time of 50 ms and sampled at 48 kHz. The level of the noise was not distributed evenly across loudspeakers. Instead, a lower level was presented from the rear loudspeaker (180°), and then the level increased monotonously in a counterclockwise manner for each loudspeaker (see Fig. 2). For 135° (rear-right), the level was 4.3 dB higher than for 180°, 7.3 dB for 90° (right), 9.5 dB for 45° (front-right), and 11.3 dB for 0° (front). The level increase was continued in the left hemisphere (13.0 dB at 225°, 14.4 dB at 270°, 15.6 dB at 315° to the left). The last loudspeaker along the circle (187.5°) had a level that was 16.7 dB higher than the rear loudspeaker. Overall, the speakers on the left side produced a 6.8 dB higher level than the speakers on the right. These differences in sound output resulted in a higher level of about 1.8 dB at the left compared to the right ear due to the angular dependence of HRTFs and head shadow effects. The asymmetry was introduced to gain insights into the impact of asymmetrical masking on localization abilities. In a symmetrical setup, target signal presentation from the left and right hemisphere could be expected to produce symmetrical results with little additional information. However, studies like [28] have shown that asymmetric localization accuracy can occur in one third of the listeners.
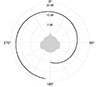 |
Figure 2. Level of pink noise played back at each loudspeaker compared to the level of the loudspeaker in the back of the participant. |
The target signal level was equal to the overall A-weighted sound pressure level of the noise over all loudspeakers as measured with a handheld sound level meter at the position of the listeners’ head in the absence of a listener. This broadband SNR of 0 dB resulted in a local SNR of about 15 dB in the third-octave bands around the main frequency components for the tonal signal, and 8–10 dB local SNR in the relevant third octave frequency bands for the multi-tone (see Fig. 1). Both target signals in noise were presented at overall levels of 70 dB(A) and 85 dB(A) to consider different levels of attenuation or amplification of the incoming sound due to the level-dependency of the investigated HPDs. The signal playback was calibrated with a sound level meter XL2 by NTi Audio. Individual loudspeaker levels did not differ by more than 2 dB.
2.4 HPD conditions
Overall, six measurement conditions with HPDs were measured. For each measurement condition, a full set of localization trials was presented to the listeners and localization judgments were collected. The first condition was conducted with the target signals alone with open ears and only measured at 70 dB(A) to reduce measurement time. It was used for the purpose of familiarization to the target signals without distraction by the noise. All other measurement conditions were conducted in background noise. A measurement with open ears in noise was used as a baseline condition. Two HPDs, an earmuff and an earplug, were both measured in passive mode and one of the level-dependent settings. The earmuff works dichotically in its active settings. For the earplug, the second-highest and for the earmuff, the highest active setting was chosen, because they produced similar input-output curves for pink noise stimuli as indicated in Figure 3. The free-field equalization of the input-output curves was derived by subtracting the free-field transfer function from the recorded noise signals with the artificial head. The transfer function was obtained from pink noise measured with a reference microphone compared to the artificial head microphones in the same measurement setup. Premolded triple flange eartips were used for the earplugs. The microphones of the earplugs were located close to the opening of the earcanal. In contrast, the microphones of the earmuffs had a distance of about 6 cm to the earcanal due to the width of the earcups. The microphones were placed in the lateral coverings, shifted to the bottom and front of each cup, respectively. Information about the signal processing of the devices was not available.
 |
Figure 3. Free-field equalized input-output curves of the tested HPDs for pink noise stimuli in passive mode (Setting 0, black solid line) and all available active settings, measured with the artificial head. The dashed line represents the sound pressure level at the ear simulator microphone with open ears. Settings 2 (earplug) and 4 (earmuff) were used in the listening tests. |
2.5 Procedure
2.5.1 Listening experiment
The listening experiment consisted of three sessions per subject with a duration of about 70–100 min each. In the first session, the participants filled out the forms for written consent, data handling, account details for their compensation and the questionnaire regarding hearing impairment. Afterwards, they conducted a short training session without HPD to get familiar with the sound localization task and handling of the knob. The training session contained 48 trials in noise, each presented from a different loudspeaker and a randomly selected (but equally distributed) alarm signal and level. Following the measurement of the hearing threshold with the SIUD procedure, the localization measurements without HPD were conducted without and with noise. This session usually took the longest time due to explanations and familiarization with the experiment.
The sound source localization experiments with the HPDs were conducted in the second and third session. In both sessions, one of the HPDs was measured in active and passive setting, respectively. The presentation order of HPDs and settings were balanced across all participants. At the beginning, instructions for a correct fitting of the HPD and adjustment of the active setting were given. During fitting in passive setting, pink noise was played back to get immediate acoustical feedback of the attenuation behavior, and the experimenter checked visually for a proper placement of the HPD. Afterwards, the SIUD procedure as mentioned in Section 2.1 was redone in passive setting to check for correct fit of the HPDs. This was especially of importance for the earplugs because they do not always fit tightly as shown in [29, 30]. The resulting attenuation was calculated as the difference between the thresholds in the SUID procedure with open ears (from the first session) and with HPDs. If the attenuation was obviously too low and clearly outside reference values by the manufacturer, the HPD had to be refitted and thresholds measured again. This happened especially for the earplugs where different sizes of ear tips were tried out. Three participants had to be excluded from the analysis of data with the earplug because no tight fit could be ensured. The participants were instructed not to take off the devices for the whole measurement session after establishing a good fit. Otherwise, the fitting procedure had to be redone which happened for one participant for each HPD.
For all test measurements, the 48 loudspeaker directions were divided into 16 sections of three loudspeakers each to reduce the duration of the measurements. Per HPD condition, each combination of signal level and signal type was presented five times per section (i.e., from one of the three loudspeakers). This resulted in a total of 320 trials per HPD condition (2 noise levels × 2 alarm signals × 16 sections × 5 repetitions) except for the condition without background noise (160 trials) which was only played back at 70 dB(A). For each HPD condition, the trials were presented in a randomized order.
The participants were allowed to take a break after half of the trials per condition and between conditions. Moreover, they were instructed to keep their head looking towards the front before starting the measurement and while listening to the stimuli. A red LED indicated the frontal direction (0° azimuth) to look at to help participants. A movement of the head, torso or chair was only allowed to adjust their response after offset of the stimulus. After the adjustment, they were asked to turn back into the starting position for the next trial. By pressing the knob, they confirmed their answer. The LED returned to its initial position and the following trial started.
2.5.2 Technical measurements
For the measurements with the artificial head, each combination of signal level and measurement signal was played back for all HPD conditions and loudspeaker directions and recorded for both ears. Since the HPDs operate in a non-linear manner, alarm signals and noise could not be recorded separately for later analysis. Accordingly, the phase inversion method by Hagerman and Olofsson [31] was applied, i.e., each signal consisting of target signal (S) and background noise (N) was played back and recorded three times: the first time exactly as in the subjective tests (S+N), the second time with the identical target signals but phase-inverted noise signals (S−N), and the third time with phase-inverted target and noise signals (−S−N). Addition and subtraction of the first (S+N) and second (S−N) recorded signals allows for an approximate extraction of the isolated signals S and N after (non-linear) processing as long as the signal phases are not modified [31]. Adding the original signal (S+N) to the fully phase inverted signal (−S−N) results in a verification signal that should be ideally zero. As suggested in IEC 60118-16 [32], the level of the verification signal should be at least 10 dB lower than the levels of the extracted target and noise signals.
In addition to the mixed target and noise signals, the clean target signals were recorded without background noise for open ears to compare the obtained binaural cues with those of the extracted target signals. This was done to gain confidence in the phase inversion method. To consider random effects as well as to gain insights in the test-retest reliability and measurement error, all signals were recorded several times for all 48 angles: (1) Two times without repositioning artificial head or HPDs to consider random loudspeaker and sound field effects, (2) two more times after dismounting and repositioning the HPDs, (3) and two more times after fully dismounting and repositioning the artificial head as well as HPDs to gain insights in the test-retest reliability and measurement error due to different positioning. This resulted in 5–7 repetitions per HPD condition. The measurement error was calculated as the root mean square of the standard deviations obtained for each angle per measurement condition.
2.6 Analysis and statistical method
2.6.1 Listening experiment
Different analyses were carried out for the group data pooled over all participants for all measurement conditions. Most analyses were adapted from the analyses for method 2 in ANSI/ASA S3.71-2019, “Methods for Measuring the Effect of Head-worn Devices on Directional Sound Localization in the Horizontal Plane” [33]. The front-back and back-front reversals with correction for guessing were calculated as described for all participants across all target directions. The angular error (AE) with mean and standard deviation was calculated for each of the 48 source directions (instead of 36 directions as in the standard) after correcting for front-back and back-front reversals for the group of participants.
In addition to the analyses specified in the standard, heatmaps for visualizing typical confusions were created and the percentage of contralateral errors with correction for guessing was computed. A contralateral error was counted if the target direction was between 20° and 160° and the response angle between 200° and 340°, or vice versa. All statistical analyses were conducted in R (v4.2.2) with an α-level of 0.05 for significance testing. All data were tested for normality (Shapiro Wilk’s test) and sphericity (Mauchly’s test).
2.6.2 Technical measurements
ITDs and ILDs were calculated for each target direction from the extracted target signals from the original recordings with background noise by using the phase inversion method as described above. In addition, ITDs and ILDs were also calculated from the clean target signals (recorded without background noise for open ears) to validate the results of the phase inversion method. For further validation, the verification signal was calculated for each condition. The phase inversion method to extract the target signals was applied for each ear after filtering the recorded signals with a bandpass filter with edge frequencies at 900 Hz and 1400 Hz (i.e., the range of the spectral components of the alarm targets).
For the calculation of the ILDs, only a 200 ms time period that contained the steady-state target signal without on- and offset was extracted. The ILDs were calculated as the difference between the sound pressure level at the left and the right ear. In contrast, the 100 ms long time period immediately following signal onset was analyzed to utilize the temporal onset characteristics of the signal’s envelope, which provide clearer interaural timing cues than the continuous steady-state portion. The Matlab function xcorr() with the left and right recordings as input was used to get the cross-correlation sequence of the two signals. The estimated ITD was the lag at which the cross-correlation between the signals at both ears was largest.
To quantitatively link the behavioral data and technical measurements, a correlation analysis of the angular error and absolute changes in ILDs with HPDs compared to open ears was conducted. The Matlab function corrcoef() was used to derive the correlation coefficients and p-values.
3 Results
3.1 Listening tests
For visual inspection of the response pattern of the participants in a subset of different HPD conditions, Figure 4 shows heatmaps of the results pooled over all participants, target signals and levels for open ears without background noise (left), open ears with background noise (middle), and the level-dependent mode of the earmuffs (right). The axes show angles selected by the participants over the true target angles from 0° (front) over 90° (right), 180° (back), and 270° (left) to 360° (front), respectively. The brighter the color, the more participants selected that angle. Perfect localization performance would be indicated by a diagonal line. The results should lie within the lower left or upper right quadrant to be distinguished correctly between left and right. The condition without background noise (left) showed a preponderance of correct answers (diagonal line), additional front-back reversal errors in both directions (crossing diagonal lines in both hemispheres), but nearly no contralateral errors (data points in the top left or bottom right quadrant). Additional background noise (open ears, middle) resulted in a higher variation and spreading of the results, more front-back reversal errors, and slightly more left-right confusions. In contrast, the results with the active earmuffs showed considerably increased variance and a much less pronounced pattern of correct responses and systematic front-back confusions. Several contralateral errors occurred that were mainly perceived towards the right instead of left, but not vice versa. A similar tendency could be seen with open ears in noise. Further heatmaps can be found in Figures S.1–S.4 to get an insight in how different conditions, signals and levels affected the results.
 |
Figure 4. Excerpt of heatmaps of three conditions: open ears without background noise (left), open ears in noise (middle), and level-dependent earmuffs in noise (right). Gray-scaled pixels indicate the relative frequencies of the participants’ responses plotted against the true target angles. Data were pooled across participants, alarm signals, and playback levels. |
3.1.1 Front-back reversal errors
For each participant and measurement condition, the percentage of reversal errors with correction for guessing was calculated. Figure 5 shows the median results of all participants per condition. The limits of the boxes represent the 25th and 75th percentile, whiskers the maximum and minimum within ±1.5 times the interquartile ranges, and outliers are depicted as crosses. The horizontal dashed lines are the median results with open ears without background noise. Without background noise, reversal errors occurred much less often with the tonal signal (median 0.3%, 25th percentile 0%, 75th percentile 9.5%) than with the multi-tone signal (median 16.9%, 25th percentile 13.2%, 75th percentile 25.1%). In comparison, the percentage of reversal errors with open ears in the presence of background noise increased for the tonal signal (9.5–13.9%) but decreased with the multi-tone (8.0–15.4%). This trend could be seen in all other HPD conditions as well.
 |
Figure 5. Boxplots with percentage of front-back reversal errors (with correction for guessing) for each tested condition. The dashed red lines correspond to the respective mean results with open ears without background noise. |
Concerning the influence of the level-dependent settings, the tested active mode in the earplugs resulted in up to 5.9 percentage points fewer reversal errors than in passive mode. The same applied for the earmuff (except for the tonal signal at 70 dB(A)) with up to 7.4 percentage points fewer confusions in the active setting. Additionally, the variation in the participants’ results was largest with the passive earmuff. Except for the earplugs with the multi-tone which led to the same results, all HPD and target signal conditions resulted in 0.5–6.7 percentage points fewer reversal errors with the higher signal level compared to 70 dB(A). In contrast, a comparison of the two target signals showed no clear trend except rather similar results for all HPD conditions with the tonal signal whereas the median results with the multi-tone varied over a larger range. At least with the active earmuffs at both levels, fewer reversal errors occurred with the multi-tone than with the tonal signal. Further examination of the data revealed that for all conditions, participants tended to answer more often towards the front than back (not shown).
A three-factorial repeated-measures Analysis of Variance (ANOVA) with HPD, level, and signal as independent variables and the percentage of confusions as the dependent variable was conducted. The results of the ANOVA and the corresponding post-hoc tests can be found in Table 1. The sphericity assumption was met and Shapiro Wilk’s test on normality led to a p-value of at least 0.026 for each data set and confirmed the assumption of normally distributed data for 15 of 20 data sets. The results without background noise were not considered for this analysis because it was not of main interest but mainly for familiarization, and only measured at the lower level.
Statistical results of three-factorial repeated-measures ANOVA and post-hoc tests on front-back reversal errors. Significant results are marked bold. The results of the one-way ANOVA for multi-tone signal at 85 dB(A) were Greenhouse-Geisser corrected due to violated sphericity assumptions.
The ANOVA revealed significant main effects of level and HPD, and a significant interaction between signal and HPD. Significantly more front-back confusions occured with the lower compared to the higher level. Additionaly, post-hoc one-way ANOVAs indicated effects of the HPDs only for the multi-tone signal at both levels. For both levels, post-hoc Bonferroni-Holm corrected t-tests revealed significantly fewer reversal errors with the active earmuff compared to open ears and passive earplugs with the multi-tone signal. At 85 dB(A), there were even fewer reversal errors compared to the active earplugs.
3.1.2 Angular error
The AEs shown in Figure 6 were pooled over all participants, levels and targets signals. The different panels show the mean (dashed line) and standard deviation of the AEs for each target angle and HPD condition. Without background noise (top left), the maximum mean AE over all directions was 23.9°. The smallest errors occurred in the front (12.7°), on the left (11.8°), and on the right (10.6°) of the participants. The AEs increased with background noise (bottom left), and a comparable error pattern was observed for the earplugs in both settings (middle panels). The mean AEs were smaller for signals arriving from the right (17.7°–38.1°) than from the left (27.1°–59.0°).
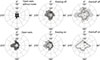 |
Figure 6. Mean (dashed line) and standard deviation of the angular error distributions with front-back correction for each HPD condition pooled over all participants and target signals and levels. |
The largest mean errors with the passive earmuff were about 75.0° in the frontal hemisphere and for signals from the left. In the active setting, mean AEs were even larger and reached up to 113.5° in the left hemisphere. Mean AEs were also larger for signals from the right compared to the passive setting. In both earmuff conditions, the localization accuracy was best for signals from the back left and right (31.1°–37.0°) in passive setting, and for rightwards signals in level-dependent mode. Thus, the mean AEs over angles differed in shapes: In passive setting, the errors were more evenly distributed over the whole frontal hemisphere whereas they were particularly large towards the left and right in the active mode. The angular error was analyzed descriptively only, as the observed directional patterns are consistent with the statistical findings on left-right confusions presented in the following Section 3.1.3. Apart from the very lateral angles of about 90° and 270°, the level-dependent setting worsened the AEs on the whole left hemisphere by up to 44.6°, but increased the localization accuracy compared to passive mode by up to 30.8° on the frontal and rear right. A separation of the results for both signals and levels revealed that the large errors for the lateral angles were much more prominent in the tonal than the multi-tone signal, and that the errors were larger at the higher compared to the lower level. A visual breakdown of the AEs per signal and level can be found in https://acta-acustica.edp-sciences.org/10.1051/aacus/2026002/olm–https://acta-acustica.edp-sciences.org/10.1051/aacus/2026002/olm.
3.1.3 Contralateral errors
The percentage of contralateral errors was calculated to check the degree of the localization errors towards the opposite side. Figure 7 shows the median percentage of contralateral errors for each HPD, signal and level condition. No contralateral errors occurred with open ears in the absence of background noise. With noise, either the passive or active earplugs led to the lowest median error rates, and the earmuffs to the highest errors (up to 23.8%). Interindividual differences were much larger with earmuffs than in the other conditions. The largest range of individual errors was between 1.3% and 58.8% for the passive earmuff at 85 dB(A). In contrast, the maximum of the median with open ears in noise and both earplug conditions was 3.8%.
 |
Figure 7. Median percentage of contralateral errors (with correction for guessing) for each tested condition. The dashed red lines correspond to the respective median results with open ears without background noise. |
A general trend regarding improvements or decrements using active earplugs in comparison to open ears or the passive setting was not apparent. Similarly, the different signals and levels showed no consistent influence for earplugs. In contrast, they clearly affected the results with earmuffs. The tonal signal increased the median percentage of contralateral errors for earmuffs in passive mode by 6.3 percentage points at 85 dB(A), and even doubled them at 70 dB(A), compared to the multi-tone signal. No clear trend regarding the influence of level per signal could be seen for the passive earmuffs. In contrast, the target signal did not influence the results with active earmuffs, but the higher level increased the errors by up to 8.1 percentage points compared to the lower level. Thus, the advantage or disadvantage of the active in contrast to the passive setting depended on the signal and its level. The active setting was beneficial at lower levels, especially with the tonal signal, but detrimental at higher levels, especially with the multi-tone signal.
According to Shapiro Wilk’s test on normality, the data were not normally distributed except for four streams of data (p < 0.313). As a non-parametric alternative, the three factors level, signal, and HPD were analyzed separately using Friedman tests. Table 2 shows the results. To assess the influence of HPD, the data were aggregated by subject and HPD using the median value. The Friedman test indicated a significant difference between the HPD conditions. Post-hoc Dunn tests with Bonferroni correction revealed significantly more contralateral errors with the earmuffs than in the other HPD conditions in both settings. There was no significant difference between both earmuff conditions, and between the other HPD conditions. The data were aggregated over subject and level or signal to assess the statistical influence of level or signal, respectively. Wilcoxon signed rank tests revealed no influence of signal, but of level (higher errors overall at the higher level).
Statistical analysis of the three factors level, signal, and HPD on contralateral errors, and post-hoc tests. Significant results are marked bold.
3.2 Technical measurements
Before analyzing the ITDs and ILDs, the reliability of the phase inversion method was verified by computing the verification signals from (Signal+Noise) + (−Signal−Noise) measurements. IEC 60118-16 requires the verification signal levels to be at least 10 dB below the levels of the extracted target and noise signals. The analysis revealed 99% compliance for target signals (31.1 dB average separation) and 100% compliance for noise signals (29.8 dB average separation). The few non-compliant cases occurred randomly across different angles rather than systematically at specific locations. The phase-inversion process achieved approximately 30 dB noise reduction, providing sufficient signal separation for a reliable analysis of the binaural cues.
To quantify the measurement error of the ILDs derived from the phase-inversion method, the additional repeatability measurements were analyzed. The analysis revealed substantial differences across conditions. Open ear measurements (0.7 dB RMS error) as well as the tested active modes (1.1−1.3 dB RMS error) showed excellent repeatability. In contrast, the ILDs in the passive settings of both HPDs varied largely (5.4−5.6 dB RMS error, and maximum differences up to 28.6 dB between any two repetitions with the tonal signal and passive earplugs). Refitting of the HPDs led to the largest variability of ILD and thus, was identified as the primary contributor to the measurement error. In contrast, artificial head repositioning and repeated playback showed minimal effects on ILD measurements.
The calculated values for the ILDs of a single measurement at each direction are illustrated for the tonal signal at 70 dB(A) in Figure 8. ILDs for the other conditions can be found in Figures S.9–S.11. Negative ILDs for signals from the right (0° − 180°), positive ILDs for signals from the left (180° − 360°), and no ILDs for frontal (0°) or rearwards (180°) sources were expected for open ears. Interestingly, for the “Earmuff on” condition in some instances, ILDs are reversed in direction. Note that the asymmetric masker level distribution (Fig. 2) was not expected to produce asymmetric ILDs because the target signal was extracted from the masker using the phase inversion method as described above, and the ILDs were calculated from the extracted target. Without background noise, the ILDs directly in the front (0°) and back (180°) were below 1.5 dB. ILDs were largest on the left (270°) and right (90°)±40°, respectively.
 |
Figure 8. Calculated ILDs for each HPD condition for the tonal signal at 70 dB(A), either calculated out of the clean target signals (open ears, without noise) or extracted by the phase-inversion method. |
For validation purposes of the phase-inversion method, the ILDs with open ears (with and without background noise) were compared. Two directions sticked out in the results for the tonal alarm at 70 dB(A): The maximum ILDs with open ears estimated from the phase inversion method on the left and right were up to 3.5 dB (60°) and 7.0 dB (330°) larger than those calculated from the clean target signals measured without background noise. Apart from these two directions, the measured ILDs with open ears with and without background noise differed for each angle by less than 2.9 dB, mostly less than 1.7 dB.
With background noise, the ILDs in Figure 8 with open ears and the active earplugs led to comparable results with differences below 3.0 dB. In contrast, the ILDs differed up to 18.0 dB with the passive earplugs. Nevertheless, the general trend of the ILDs remained although the peaks and troughs were generally less pronounced than with open ears and active earplugs. Exceptions were found for frontal signals with +8.5 dB ILDs pointing towards the left, the frontal right area where the ILDs were reverted and consistent with a sound coming from the opposite direction or most likely towards the front, and at +165° with a highly pronounced ILD towards the right. Thus, the active setting of the HPDs preserved the ILDs better than the passive mode in comparison to open ears.
The earmuffs in passive setting altered the ILDs for the tonal signal at 70 dB(A) particularly with regard to the frontal right region up to 30° indicating a signal arriving from the left or front. Overall, the general trend of the ILDs was altered by means of partly switched peaks and troughs which led to large differences compared to the ILDs with open ears. In contrast, the ILDs were lowered for each direction with the active earmuffs, and even reversed towards the contralateral side for signals arriving from the left (270°) and right (90°) ±30°, respectively. The values of the reversed ILDs reached more than 7.5 dB towards the contralateral side. Except for these lateral directions, the ILDs were preserved better than with the passive setting, especially for frontal signals.
Compared to the tonal signal, the general trend and the values of the troughs remained similar with the multi-tone signal for each device, but the peaks were up to 18.2 dB less pronounced (see https://acta-acustica.edp-sciences.org/10.1051/aacus/2026002/olm). Accordingly, the differences between the peaks and troughs as well as between the HPD conditions became smaller. The different trend in the passive earmuff compared to the other conditions became less distinct, and reversed ILDs with the active earmuff were very small (< 1.6 dB) and occured rarely. In contrast to the differences in ILDs between signals, the level had a smaller influence on the ILDs. The difference between both levels with the multi-tone signal (Fig. S.10) was < 0.6 dB for all HPD conditions except the active earplugs (< 2.2 dB). With the tonal signal (Fig. S.11), the differences between the different HPD conditions, including the reversed ILDs and peaks with the earmuffs, were more pronounced at 85 dB(A) than at the lower level. An exception were the results with the active earplugs which still showed a similar trend as open ears but with smaller absolute ILDs on each side. All in all, the differences between the HPD conditions were more distinct at the higher level and with the tonal signal.
The correlation analysis between the angular localization errors (Figs. 6, S.5–S.8) and absolute ILD changes (HPD conditions vs. open ear from Figs. 8, S.9–S.11) was limited to the active earmuffs due to methodological constraints. For both HPDs in passive setting, the high fit-related variability in ILD measurements precluded a meaningful correlation analysis, as individual participant fit conditions and corresponding ILD alterations could not be determined. For the tested active earplugs, the minimal variance in ILD changes compared to open ear ILDs (< 5 dB) resulted in insufficient data spread for a robust correlation analysis. Significant correlations with the tested active earmuffs were found for both signals at both levels (tonal: r = 0.30 (70 dB(A)) and r = 0.32 (85 dB(A)), p < 0.037; multi-tone: r = 0.51, p < 0.001 for both levels). These results indicate a moderate relationship between the ILD alterations and behavioral performance with the tested earmuffs in active setting. An additional correlation analysis between ILD alterations and the changes in angular error compared to open ears resulted in similar findings.
The differences of the tested conditions with respect to ITDs at 70 dB(A) can be found in Figure 9. Since the noise floor of residual noise in the measurement equipment was relatively high in the passive conditions with low incoming sound pressure level at the microphones, an automatic analysis of ITDs could not be obtained. Instead, they were analyzed manually by visual inspection for certain angles as indicated by crosses in the figure. The recorded signals with open ears without background noise were computed automatically as well as manually to compare the results. Automatically computed ITDs per cross-correlation in Matlab are visualized as solid lines. The automatically and manually calculated ITDs with open ears without noise differed in maximum by 0.04 ms. In case the automatic computation of cross-correlation resulted in a flipped phase due to the ambiguity of the target signals’ frequency components, this was detected, visually checked and compensated (dashed lines). The ambiguity occurred much more often with the tonal signal than with the multi-tone signal, irrespective of HPD condition. The automatically calculated ITDs were symmetric around 0° with maximum values at the left (270°) and right (90°). An influence of the HPD conditions on the ITDs could not be found except for slightly increased maximum values with the earmuffs in the active setting. The ITDs with open ears, earplugs and passive earmuffs were in the range of ±0.75 ms for both signal types. With the active earmuffs, the maximum ITDs were increased to ±0.92 ms. However, the general pattern remained similar over all conditions. The results at 85 dB(A) were similar.
 |
Figure 9. Calculated ITDs for each HPD condition for both signal types at 85 dB(A), either calculated out of the clean target signals (open ears, no background noise) or extracted by the phase-inversion method. The data were calculated automatically (solid lines) and corrected for phase, if necessary (dashed lines). If no automated calculation was possible, the data were analyzed manually (crosses). The data for open ears without background noise (played back only at 70 dB(A) were analyzed automatically as well as manually for certain angles |
4 Discussion
In the reported listening tests, best localization accuracy and fewest confusions (Figs. 5–7) were reached without any background noise and the tonal target signal. Unexpectedly, the multi-tone signal in quiet led to more front-back reversal errors than the tonal signal. These findings contradict those of Vaillancourt et al. [19] who also measured with open ears, but with noise. We supposed that signal-specific interactions with individual HRTF characteristics might have manifested as systematic response biases, but the analysis revealed no such signal-dependent bias patterns. While a general bias toward frontal responses was observed, this bias was consistent across both signal types and therefore does not explain the increased reversals with the multi-tone signal. The underlying mechanism for this counterintuitive finding remains unclear and needs further investigation. However, no contralateral errors and only small angular errors occurred with the multi-tone alarm in the current study. This indicates that the participants were quite certain about the correct direction but only confused between front and back. On the one hand, those confusions can easily be resolved by head movements in practice, which subjects were instructed not to perform during stimulus presentation in these experiments. On the other hand, any confusion can increase the time needed to localize sounds. To gain insights in the effective influence of any error on safety, a dynamic test paradigm such as the third method described in [33] should be employed to assess the overall time needed to localize correctly.
Regarding all conditions with background noise, open ears neither led to the fewest front-back confusions nor contralateral errors. However, while HPDs reduced certain error types in noisy conditions, this typically occured at the expense of increased errors in other dimensions, resulting in no overall improvement over open ears. As expected from several former studies, the tested earplug conditions and open ears led to similar results concerning front-back confusions [19] and contralateral errors [7, 8, 19]. All of them reported percentages of left-right errors lower than 5%. The measured ILDs in these conditions support the findings as well, because they appeared to be well preserved or at least pointed in the correct lateral direction. Different results were observed by Bolia et al. [6] and Zimpfer and Sarafian [10] who found increased reversal errors with their tested earplugs compared to open ears. The larger AEs on the left than on the right were most likely due to the asymmetrical noise with a higher level and, respectively, a smaller SNR on the left. The AEs on the right are in line with the findings of Good and Gilkey [34] and Lorenzi et al. [35] who used a similar SNR as the current study. Additionally, both studies showed that the errors rise with (higher) background noise which supports the findings of larger AEs on the left than on the right.
Overall, the tested earplugs in our study outperformed the earmuffs concerning AEs and contralateral errors (Figs. 6 and 7). Several former studies found similar results [7, 9, 10, 17, 19]. However, the tested earmuffs in our active setting led to the fewest front-back reversal errors which is contradictive to the previously mentioned studies who typically found more front-back reversal errors with earmuffs compared to their other measured conditions. Additionally, most former studies (that used different SNRs or target signals in quiet) usually found more reversal errors [7, 19] and fewer contralateral errors [7, 8, 18, 19] with their tested active earmuffs compared to those in the current study. The mean AEs for the earmuffs depended on the setting. The active earmuff led to larger errors on the left than on the right like the earplug and open ear conditions. Apart from that, large errors could be found directly towards the left and right where the reversed errors occurred. In contrast, the passive earmuff was not that influenced by the different SNRs on the left and right, possibly because of too much confusion overall. Therefore, in case of the tested earmuffs in both settings, a second factor apart from the asymmetric noise (as seen in the open ear and earplug conditions) influenced the AEs: the largely altered ILDs (Fig. 8). The passive earmuff changed the ILDs due to the covered pinna and consequently different frequency-dependent patterns as created by the scattering of high frequencies at the pinna. The general pattern of the ILDs with peaks and troughs was modified. This led to the decrement of performance over a broad range of incident angles, mostly towards the front of the listener. These errors could potentially be corrected by visual cues in real-life scenarios. However, the visual cues might only be beneficial if the measurement error stays within a limited range that can be easily captured by vision. Otherwise, the time needed to localize the sounds in real-life most likely also increases which then can also lead to safety risks.
While the generally larger AEs on the left than on the right hemisphere with the tested active earmuff (Fig. 6) are still most likely due to the asymmetrical noise, the extraordinary large AEs towards the left (270°) and right (90°) can be explained by the reversed ILDs towards the contralateral side (Fig. 8). These findings also fit to the large percentage of contralateral errors. Such errors on the sides and even slightly towards the back are harder to correct by visual cues and might lead to an increased time needed to find the sound sources in real-life scenarios. The switched ILDs might be explained by the compressive behavior of the earmuffs. For incident signals from the right, the higher level at the right ear might be more compressed than the lower level arriving at the left ear. This effect should be stronger at higher sound levels due to the higher compression of the level-dependent HPDs. A larger influence of the higher level was indeed found concerning the contralateral errors or AEs. Nevertheless, the different compression should not lead to negative values according to the measured input-output curves of the tested earmuff. The correlation analysis provides quantitative support for the relationship between ILD alterations and localization performance in the active earmuffs, revealing significant correlations for both signals at both levels. While more sophisticated modeling approaches such as those by Baumgartner et al. [36] in [20, 22] or spectral cue analyses as demonstrated by Brown et al. [4] could provide additional insights, the limited frequency range of the target signals (1000–1300 Hz) constrains the applicability of such approaches since spectral cues crucial for localization typically occur between 2 and 16 kHz [4].
The same earmuff as in the current study was investigated in the study of Laroche et al. [9]. An increased number of contralateral errors was found, but not in the same dimensions as in the current study. A reason might be the reduced number of used loudspeakers and directions in their study. The directions that were critical in the current study could have simply not been investigated. Moreover, the target signals in the current study were ramped which typically decreases localization performance due to missing onset cues. This factor could be another reason for the different performances in the current study compared to those of Laroche et al. [9]. However, we were mostly interested in to what extent the level-dependency of the hearing protectors affects localization performance and if or how technical measurements are connected to the performance. By eliminating the sharp onset cue, the analysis and interpretation of the results could be focused solely on the HPDs’ influence. In contrast to the study of Laroche et al. [9], Brungart et al. [24] found reversed ILDs in the frequency region of the tested warning signals with one active earmuff as well. This supports the findings of the current study. Nevertheless, a hidden defect within the currently tested device cannot be excluded. A defect can be very hazardous considering occupational safety because it is not apparent for the user. This could lead to an increased time in assessing the correct direction of an approaching alarm-emitting vehicle and, consequently, to an increased risk of accidents. Further investigations with more copies of this earmuff and other HPD devices are necessary to find out if the results with this earmuff are an individual case or a more systematical problem. The good fit of the hearing test data with the technical results suggests that the less complex investigation of ILDs would be sufficient to check the devices.
Overall, the results regarding an improvement or degradation of localization performance by using level-dependent instead of conventional passive devices are conflictive as indicated by the literature. The study by Mlynski and E. Kozlowski [17] showed an improvement, reduction or no difference between performances depending on the used device. Larger differences between the settings were found with their earmuffs than earplugs. The results are in line with the current study, where the seleted active setting was disadvantageous regarding contralateral errors and AEs for the tested earmuffs, but not the tested earplugs. With the earmuffs in active setting, more and larger errors occurred, especially at the higher level. Although reversal errors diminished in the tested active compared to the passive setting with both HPDs, this reduction likely reflects the overall localization disruption rather than improved performance, as severe angular errors and contralateral responses preclude classification as simple front-back reversals. The large number of contralateral errors with the active earmuffs leads to an increased risk concerning safety at work since, typically, levels above 70 dB(A) are very often present in occupational scenarios where HPDs need to be worn. However, our findings are for two particular examples of devices and one level-dependent setting each only. We caution to generalize these finding on all level-dependent settings and earmuffs or earplugs based only on the presented results since their conservation of spatial cues depends on the HPD’s physical characteristics, microphone processing as well as their processing algorithms. Conducting this experiment again with several level-dependent earmuff and earplug devices with different characteristics would be beneficial to gain insight in the specific influence of these characteristics on localization performance with realistic alarm signals at certain levels.
The type of target signal did not have an influence on most HPD conditions. Former studies suggested that broader bandwidths would lead to smaller localization errors and fewer confusions (e.g., [7–9, 37, 38]). This led to the assumption that the multi-tone with three main frequency components (1000, 1150 and 1300 Hz) in the current study should have supported a better localization performance than the tonal signal with only one main frequency component at 1250 Hz (compare signals in Fig. 1). However, the signal only made a difference when comparing the earmuffs in active and passive setting (Figs. 5 and 7). A reason for that could be that the three frequency components of the multi-tone signal only span a little more than one critical band, which may have limited the additional spectral information compared to signals with components distributed across multiple critical bands. This could explain why signal-dependent effects were observed only for some conditions. However, the results suggest that in difficult hearing conditions like with the tested passive earmuffs, localization performance is better with a multi-tone than tonal signal. In contrast, easy scenarios like when listening with the tested earplugs (that did not largely alter localization cues) are not strongly affected by the type of warning signal. This is underlined by the measured ILDs. The HPDs affected the latter more in the tonal than the multi-tone signal. This suggests that ILDs are more reliable for (warning) signals with a broader frequency range. Moreover, differences between the HPDs were more prominent in the ILDs and participants’ results when listening to the tonal signal. This is in line with the finding of Vaillancourt et al. [19]. They used the same target signals and found smaller differences in the performance between earplugs and earmuffs with the multi-tone than the tonal signal. Moreover, the tonal signal increased the number of contralateral errors, too, especially with passive earmuffs.
The measured ITDs (Fig. 9) with all HPD conditions but the active earmuffs fit to the typical maximum values that can be calculated according to [39] for a sphere with a diameter of 17.5 cm. In all these conditions, the maximum ITDs are driven by the distance of the two ears. In contrast, in case of the tested active earmuffs, the sound is picked up at the two microphones on the outside of the cups which have a larger distance than the two ears. Accordingly, the maximum ITDs are larger because they depend more on the microphones that are further apart than on the ears that are comparatively closer together.
Based on the results, the question rises why human listeners would rely on the altered ILDs instead of the ITDs when localizing the given warning signals. The frequency content (1–1.3 kHz) of the signals falls in the transition region where neither ITDs nor ILDs are particularly reliable. Since the behavioral data cannot be solely explained by the ILDs, it is possible that both cues contribute equally to the localization difficulties, particularly when ILD and ITD modifications point towards different directions, creating conflicting spatial information that significantly impairs localization performance. However, Wightman and Kistler [40] demonstrated that ILD dominance over ITD depends critically on frequency content. In their experiment, ILDs of broadband noise became increasingly dominant the more low frequencies were removed. The transition region between ITD and ILD dominance began with a highpass filter at 1–2.5 kHz. Our stimuli fall precisely in this transition range where ILD influence becomes substantial and where ITDs become ambiguous. Additionally, the ITDs as well as ILDs of the human listeners could have been more impoverished due to the noise than the technical data suggest since participants do not benefit from an internal phase inversion method. Additional analyses of ILDs derived from the bandpass-filtered mixed signals showed a similar slope as the ILDs of the extracted target signals but with lower magnitudes. These two approaches likely represent the upper and lower bounds of ILD information available to participants, with the true perceptual ILDs falling somewhere between these estimates.
The repeatability analysis provides crucial validation for interpreting the technical findings and addresses potential measurement artifacts. The ILDs with open ears showed asymmetric and unusually large values (20 dB) for certain angles, e.g., for signals arriving from 330°, substantially exceeding the typical 7 dB reported by [41] for frequencies between 1 and 1.3 kHz. These large differences cannot be explained by the small measurement error of 0.7 dB with open ears. Additional measurements with pink noise from all directions using the same measurement setup confirmed the symmetry of the artificial head and validated the setup for broadband signals. This suggests that the large ILDs are specific to the tonal alarm signal, which may interact differently with the artificial head’s acoustic diffraction patterns compared to the broadband signals typically used in literature studies. Similar differences were found in [42]. Overall, the excellent repeatability of ILDs in open ear conditions as well as in active modes, combined with the symmetry confirmed in broadband measurements, validates that the measurement setup introduced only minimal systematic error and ensures valid relative comparisons between all HPD conditions.
Additionally, the repeatability analysis strengthens confidence in the main findings regarding active earmuffs. The systematic ILD reversals observed in these devices far exceed the measurement uncertainty (±1.3 dB), confirming that they represent acoustic processing effects rather than measurement artifacts. Moreover, the consistency of these effects across multiple refittings demonstrates that the reversals are not fit-related but systematic characteristics of the used active earmuffs. However, for passive modes, a high fit-related variability (±5–6 dB) shows the need for a cautious interpretation of smaller ILD changes and reflects the challenge of achieving consistent passive HPD fit.
Beyond validating the measurement repeatability, this analysis also addresses potential limitations of the phase-inversion method itself since it has several limitations including sensitivity to random loudspeaker and sound field effects that can impact signal cancellation efficiency. However, our repeatability analysis with identical setups showed minimal variability between repetitions in all measured conditions, confirming that these random effects did not significantly impact our measurements. Combined with the excellent IEC 60118-16 compliance, this confirms the reliability of the ILD measurements with the phase-inversion method and strengthens confidence in the observed effects.
A further limitation of this study is the use of artificial head measurements rather than individual HRTF recordings for ILD analysis. While individual HRTFs would provide more personalized localization cues, previous research supports the validity of our population-level approach. Genuit et al. [43] demonstrated that monaural HRTFs in the horizontal plane showed significantly less variation between different artificial head measurement systems than between individual subjects, suggesting that artificial head measurements can provide representative ILD patterns for group analysis. This is particularly relevant for this study’s focus on systematic effects of the tested hearing protection devices rather than individual localization performance. Moreover, this approach is advantageous from an HPD design perspective, as it allows for reproducible device comparisons.
5 Conclusions
This study investigated the influence of two electronic level-dependent hearing protectors on localization performance. According to the present results, the earplugs tested in this study should preferably be worn at workplaces where auditory localization is critical because only small decrements compared to open ears could be found. In contrast, the performance with earmuffs used in our study was clearly degraded. The level-dependent setting even led to reversed ILDs at specific angles which was worse with the tonal signal and at high signal levels than with the multi-tone and at lower levels. These acoustic changes that were consistent with the directional patterns observed in the behavioral localization data suggest that modifications in interaural cues contributed to the observed localization performance changes. A reason for the reversed ILDs might be the compressive behavior of the level-dependent earmuff. The higher inaccuracy and increased risk of contralateral errors in combination with the reversed ILDs can lead to a wrong perception of an incoming warning signal, potentially increasing the risk of accidents.
Thus, it is important to check HPDs during their development for changed interaural cues compared to open ears. Further research is needed to see if the current results are an individual case or more general problem. The results can help to develop or enhance current localization models to predict which HPDs should not be used in localization-critical work environments.
Acknowledgments
The Oldenburg Branch for Hearing, Speech and Audio Technology HSA is funded in the program Vorab by the Lower Saxony Ministry of Science and Culture (MWK) and the Volkswagen Foundation for its further development. This work was supported by the German Social Accident Insurance (DGUV). We thank Martin Berdau for his support in the technical measurements.
Conflicts of interest
The authors declare no conflict of interest.
Data availability statement
Data are available on request from the authors.
Supplementary material
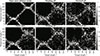 |
Figure S1. Heatmaps of all HPD conditions and participants for the multi-tone signal played back at 70 dB(A). Gray-scaled pixels indicate the relative frequencies of the participants‘ responses plotted against the true target angles. |
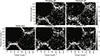 |
Figure S2. Heatmaps of all HPD conditions and participants for the multi-tone signal played back at 85 dB(A). Gray-scaled pixels indicate the relative frequencies of the participants‘ responses plotted against the true target angles. |
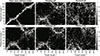 |
Figure S3. Heatmaps of all HPD conditions and participants for the tonal signal played back at 70 dB(A). Gray-scaled pixels indicate the relative frequencies of the participants‘ responses plotted against the true target angles. |
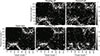 |
Figure S4. Heatmaps of all HPD conditions and participants for the tonal signal played back at 85 dB(A). Gray-scaled pixels indicate the relative frequencies of the participants‘ responses plotted against the true target angles. |
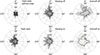 |
Figure S5. Mean (dashed line) and standard deviation of the angular error distributions with front-back correction for each HPD condition pooled over all participants for the multi-tone signal at 70 dBA. |
 |
Figure S6. Mean (dashed line) and standard deviation of the angular error distributions with front-back correction for each HPD condition pooled over all participants for the multi-tone signal at 85 dBA. |
 |
Figure S7. Mean (dashed line) and standard deviation of the angular error distributions with front-back correction for each HPD condition pooled over all participants for the tonal signal at 70 dBA. |
 |
Figure S8. Mean (dashed line) and standard deviation of the angular error distributions with front-back correction for each HPD condition pooled over all participants for the tonal signal at 85 dBA. |
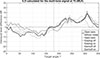 |
Figure S9. Calculated ILDs for each HPD condition for the multi-tone signal at 70 dB(A), either calculated out of the clean target signals (open ears, no background noise) or extracted by the phase-inversion method. |
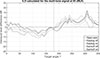 |
Figure S10. Calculated ILDs for each HPD condition for the multi-tone signal at 85 dB(A), calculated out of the extracted target signals by the phase-inversion method. |
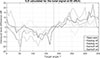 |
Figure S11. Calculated ILDs for each HPD condition for the tonal signal at 85 dB(A), calculated out of the extracted target signals by the phase-inversion method. |
References
- German Institute for Occupational Safety and Health: Noise at the Worklpace (Lärm am Arbeitsplatz), IFA, 2021. [Google Scholar]
- E. Kazan, M.A. Usmen: Worker safety and injury severity analysis of earthmoving equipment accidents. Journal of Safety Research 65 (2018) 73–81. [Google Scholar]
- NIOSH: The worker health chartbook 2004, 2004. [Google Scholar]
- A.D. Brown, B.T. Beemer, N.T. Greene, T. Argo, G.D. Meegan, D.J. Tollin: Effects of active and passive hearing protection devices on sound source localization, speech recognition, and tone detection. PLoS One 10, 8 (2015) e0136568. [Google Scholar]
- K. Howell, A.M. Martin: An investigation of the effects of hearing protectors on vocal communication in noise. Journal of Sound and Vibration 41, 2 (1975) 181–196. [Google Scholar]
- R.S. Bolia, W.R. D’Angelo, P.J. Mishler, L.J. Morris: Effects of hearing protectors on auditory localization in azimuth and elevation. Human Factors 43, 1 (2001) 122–128. [CrossRef] [PubMed] [Google Scholar]
- L. Fostick, N. Fink: Situational awareness: the effect of stimulus type and hearing protection on sound localization. Sensors 21, 21 (2021) 7044. [Google Scholar]
- W.G. Noble, G. Russell: Theoretical and practical implications of the effects of hearing protection devices on localization ability. Acta Oto-Laryngologica 74, 1 (1972) 29–36. [Google Scholar]
- C. Laroche, C. Giguère, V. Vaillancourt, C. Marleau, M. Cadieux, K. Laprise-Girard, E. Gula, V. Carroll, M. Bibeau, H. Nélisse: Effect of hearing and head protection on the localization of tonal and broadband reverse alarms. Human Factors 64, 7 (2022) 1105–1120. [Google Scholar]
- V. Zimpfer, D. Sarafian: Impact of hearing protection devices on sound localization performance. Frontiers in Neuroscience 8 (2014) 135. [CrossRef] [PubMed] [Google Scholar]
- S.M. Abel, S. Tsang, S. Boyne: Sound localization with communications headsets: comparison of passive and active systems. Noise and Health 9, 37 (2007) 101–107. [Google Scholar]
- T. Joubaud, V. Zimpfer, A. Garcia, C. Langrenne: Sound localization models as evaluation tools for tactical communication and protective systems. The Journal of the Acoustical Society of America 141, 4 (2017) 2637. [CrossRef] [PubMed] [Google Scholar]
- S.M. Abel, V.H. Hay: Sound localization the interaction of aging, hearing loss and hearing protection. Scandinavian Audiology 25, 1 (1996) 3–12. [Google Scholar]
- K.A. Alali: Azimuthal localization and detection of vehicular backup alarms under electronic and non-electronic hearing protection devices in noisy and quiet environments. Dissertation, Virginia Polytechnic Institute and State University, 2011. [Google Scholar]
- K.A. Alali, J.G. Casali: The challenge of localizing vehicle backup alarms: effects of passive and electronic hearing protectors, ambient noise level, and backup alarm spectral content. Noise and Health 13, 51 (2011) 99–112. [Google Scholar]
- K.A. Talcott, J.G. Casali, P. Keady, M.C. Killion: Azimuthal auditory localization of gunshots in a realistic field environment: effects of open-ear versus hearing protection-enhancement devices (HPEDs), military vehicle noise, and hearing impairment. International Journal of Audiology 51, Suppl 1 (2012) S20–30. [Google Scholar]
- R. Mlynski, E. Kozlowski: Localization of vehicle back-up alarms by users of level-dependent hearing protectors under industrial noise conditions generated at a forge. International Journal of Environmental Research and Public Health 16, 3 (2019) 394. [Google Scholar]
- G.R.C. Atherley, W.G. Noble: Effect of ear-defenders (ear-muffs) on the localization of sound. British Journal of Industrial Medicine 27, 3 (1970) 260–265. [Google Scholar]
- V. Vaillancourt, H Nélisse, C. Laroche, C. Giguère, J. Boutin, P. Laferrière: Comparison of sound propagation and perception of three types of backup alarms with regards to worker safety. Noise and Health 15, 67 (2013) 420–436. [CrossRef] [PubMed] [Google Scholar]
- P. Llado, T. Mckenzie, N. Meyer-Kahlen, S. Schlecht: Predicting perceptual transparency of head-worn devices. Journal of the Audio Engineering Society 70 (2022) 585–600. [CrossRef] [Google Scholar]
- P. Lladó, P. Hyvärinen, V. Pulkki: Auditory model-based estimation of the effect of head-worn devices on frontal horizontal localisation. Acta Acustica 6 (2022) 1. [CrossRef] [EDP Sciences] [Google Scholar]
- F. Denk, S.D. Ewert, B. Kollmeier: On the limitations of sound localization with hearing devices. The Journal of the Acoustical Society of America 146, 3 (2019) 1732–1744. [CrossRef] [PubMed] [Google Scholar]
- T. Van den Bogaert, T.J. Klasen, M. Moonen, L. Van Deun, J. Wouters: Horizontal localization with bilateral hearing aids: without is better than with. The Journal of the Acoustical Society of America 119, 1 (2006) 515–526. [Google Scholar]
- D.S. Brungart, B.W. Hobbs, J.T. Hamil: A comparsion of acoustic and psychoacoustic measurements of pass-through hearing protection devices, in: 2007 IEEE Workshop on Applications of Signal Processing to Audio and Acoustics. IEEE, 2007, 70–73. [Google Scholar]
- C. Laroche, L. Lefebre: Determination of optimal acoustic features for reverse alarms: field measurements and the design of a sound propagation model. Ergonomics 41, 8 (1998) 1203–1221. [Google Scholar]
- W. Lecluyse, R. Meddis: A simple single-interval adaptive procedure for estimating thresholds in normal and impaired listeners. The Journal of the Acoustical Society of America 126, 5 (2009) 2570–2579. [Google Scholar]
- C. Laroche: Determination des caracteristiques acoustiques optimales des alarmes de recul installees sur les vehicules lourds. Canadian Acoustics 23, 3 (1995) 19–20. [Google Scholar]
- S. Savel: Individual differences and left/right asymmetries in auditory space perception. I. Localization of low-frequency sounds in free field. Hearing Research 255, 1, 2 (2009) 142–154. [Google Scholar]
- R.G. Edwards, W.P. Hauser, N.A. Moiseev: Effectiveness of earplugs as worn in the workplace. Journal of Occupational and Environmental Medicine 20, 10 (1978) 699. [Google Scholar]
- R.G. Edwards, A.B. Broderson: A second study of the effectiveness of earplugs as worn in the workplace. Noise Control Engineering Journal 20 (1983) 6–15. [Google Scholar]
- B. Hagerman, Å. Olofsson: A method to measure the effect of noise reduction algorithms using simultaneous speech and noise. Acta Acustica united with Acustica 90, 2 (2004) 356–361. [Google Scholar]
- IEC 60118-16:2022-04: Electroacoustics – Hearing aids – Part 16: Definition and verification of hearing aid features (IEC 60118-16:2022); German version EN IEC 60118-16:2022. [Google Scholar]
- Acoustical Society of America: ANSI/ASA s3.71-2019: Methods for measuring the effect of head-worn devices on directional sound localization in the horizontal plane, 2019. [Google Scholar]
- M.D. Good, R.H. Gilkey: Sound localization in noise: the effect of signal-to-noise ratio. The Journal of the Acoustical Society of America 99, 2 (1996) 1108–1117. [Google Scholar]
- C. Lorenzi, S. Gatehouse, C. Lever: Sound localization in noise in normal-hearing listeners. The Journal of the Acoustical Society of America 105, 3 (1999) 1810–1820. [Google Scholar]
- R. Baumgartner, P. Majdak, B. Laback: Modeling sound-source localization in sagittal planes for human listeners. The Journal of the Acoustical Society of America 136, 2 (2014) 791–802. [CrossRef] [PubMed] [Google Scholar]
- C. Laroche, V. Vaillancourt, C. Giguère, M. Bibeau, V. Carroll, E. Gula, F.G. Nassrallah, H. Nélisse, J. Boutin: Effect of personal safety equipment (hearing protection and helmet) on the localization of reverse alarms, in: 12th ICBEN Congress on Noise as a Public Health Problem, 2018. [Google Scholar]
- W.A. Yost, X. Zhong: Sound source localization identification accuracy: bandwidth dependencies. The Journal of the Acoustical Society of America 136, 5 (2014) 2737–2746. [Google Scholar]
- G.F. Kuhn: Physical Acoustics and Measurements Pertaining to Directional Hearing. Springer New York, New York, NY (1987) 3–25. [Google Scholar]
- F.L. Wightman, D.J. Kistler: The dominant role of low-frequency interaural time differences in sound localization. The Journal of the Acoustical Society of America 91, 3 (1992) 1648–1661. [Google Scholar]
- E.A.G. Shaw: Transformation of sound pressure level from the free field to the eardrum in the horizontal plane. The Journal of the Acoustical Society of America 56, 6 (1974) 1848–1861. [CrossRef] [PubMed] [Google Scholar]
- L.J. Sivian, S.D. White: On minimum audible sound fields. The Journal of the Acoustical Society of America 4, 4 (1933) 288–321. [Google Scholar]
- K. Genuit, W. Brennecke, S. Peus: Standardisierung der Richtcharakteristik von Kunstkopf-Meß-Systemen, in: Deutsche Gesellschaft für Akustik e.V., editor, Fortschritte der Akustik – DAGA 96: Jahrestagung für Akustik in Bonn. Berlin, 1996, pp. 274–275. [Google Scholar]
Cite this article as: Buchholz S. Rennies J. & van de Par S. 2026. Level-dependent hearing protectors can switch the perception of sound direction. Acta Acustica, 10, 9. https://doi.org/10.1051/aacus/2026002.
All Tables
Statistical results of three-factorial repeated-measures ANOVA and post-hoc tests on front-back reversal errors. Significant results are marked bold. The results of the one-way ANOVA for multi-tone signal at 85 dB(A) were Greenhouse-Geisser corrected due to violated sphericity assumptions.
Statistical analysis of the three factors level, signal, and HPD on contralateral errors, and post-hoc tests. Significant results are marked bold.
All Figures
|
Figure 1. A-weighted sound pressure level of the target signals and overall background noise calculated using Welch’s power spectral density estimate with Hamming windows of length 2048 samples, an overlap of 1024 samples and 2048 discrete Fourier transform points. |
| In the text | |
|
Figure 2. Level of pink noise played back at each loudspeaker compared to the level of the loudspeaker in the back of the participant. |
| In the text | |
|
Figure 3. Free-field equalized input-output curves of the tested HPDs for pink noise stimuli in passive mode (Setting 0, black solid line) and all available active settings, measured with the artificial head. The dashed line represents the sound pressure level at the ear simulator microphone with open ears. Settings 2 (earplug) and 4 (earmuff) were used in the listening tests. |
| In the text | |
|
Figure 4. Excerpt of heatmaps of three conditions: open ears without background noise (left), open ears in noise (middle), and level-dependent earmuffs in noise (right). Gray-scaled pixels indicate the relative frequencies of the participants’ responses plotted against the true target angles. Data were pooled across participants, alarm signals, and playback levels. |
| In the text | |
|
Figure 5. Boxplots with percentage of front-back reversal errors (with correction for guessing) for each tested condition. The dashed red lines correspond to the respective mean results with open ears without background noise. |
| In the text | |
|
Figure 6. Mean (dashed line) and standard deviation of the angular error distributions with front-back correction for each HPD condition pooled over all participants and target signals and levels. |
| In the text | |
|
Figure 7. Median percentage of contralateral errors (with correction for guessing) for each tested condition. The dashed red lines correspond to the respective median results with open ears without background noise. |
| In the text | |
|
Figure 8. Calculated ILDs for each HPD condition for the tonal signal at 70 dB(A), either calculated out of the clean target signals (open ears, without noise) or extracted by the phase-inversion method. |
| In the text | |
|
Figure 9. Calculated ITDs for each HPD condition for both signal types at 85 dB(A), either calculated out of the clean target signals (open ears, no background noise) or extracted by the phase-inversion method. The data were calculated automatically (solid lines) and corrected for phase, if necessary (dashed lines). If no automated calculation was possible, the data were analyzed manually (crosses). The data for open ears without background noise (played back only at 70 dB(A) were analyzed automatically as well as manually for certain angles |
| In the text | |
|
Figure S1. Heatmaps of all HPD conditions and participants for the multi-tone signal played back at 70 dB(A). Gray-scaled pixels indicate the relative frequencies of the participants‘ responses plotted against the true target angles. |
| In the text | |
|
Figure S2. Heatmaps of all HPD conditions and participants for the multi-tone signal played back at 85 dB(A). Gray-scaled pixels indicate the relative frequencies of the participants‘ responses plotted against the true target angles. |
| In the text | |
|
Figure S3. Heatmaps of all HPD conditions and participants for the tonal signal played back at 70 dB(A). Gray-scaled pixels indicate the relative frequencies of the participants‘ responses plotted against the true target angles. |
| In the text | |
|
Figure S4. Heatmaps of all HPD conditions and participants for the tonal signal played back at 85 dB(A). Gray-scaled pixels indicate the relative frequencies of the participants‘ responses plotted against the true target angles. |
| In the text | |
|
Figure S5. Mean (dashed line) and standard deviation of the angular error distributions with front-back correction for each HPD condition pooled over all participants for the multi-tone signal at 70 dBA. |
| In the text | |
|
Figure S6. Mean (dashed line) and standard deviation of the angular error distributions with front-back correction for each HPD condition pooled over all participants for the multi-tone signal at 85 dBA. |
| In the text | |
|
Figure S7. Mean (dashed line) and standard deviation of the angular error distributions with front-back correction for each HPD condition pooled over all participants for the tonal signal at 70 dBA. |
| In the text | |
|
Figure S8. Mean (dashed line) and standard deviation of the angular error distributions with front-back correction for each HPD condition pooled over all participants for the tonal signal at 85 dBA. |
| In the text | |
|
Figure S9. Calculated ILDs for each HPD condition for the multi-tone signal at 70 dB(A), either calculated out of the clean target signals (open ears, no background noise) or extracted by the phase-inversion method. |
| In the text | |
|
Figure S10. Calculated ILDs for each HPD condition for the multi-tone signal at 85 dB(A), calculated out of the extracted target signals by the phase-inversion method. |
| In the text | |
|
Figure S11. Calculated ILDs for each HPD condition for the tonal signal at 85 dB(A), calculated out of the extracted target signals by the phase-inversion method. |
| In the text | |
Current usage metrics show cumulative count of Article Views (full-text article views including HTML views, PDF and ePub downloads, according to the available data) and Abstracts Views on Vision4Press platform.
Data correspond to usage on the plateform after 2015. The current usage metrics is available 48-96 hours after online publication and is updated daily on week days.
Initial download of the metrics may take a while.