Figure 4
Download original image
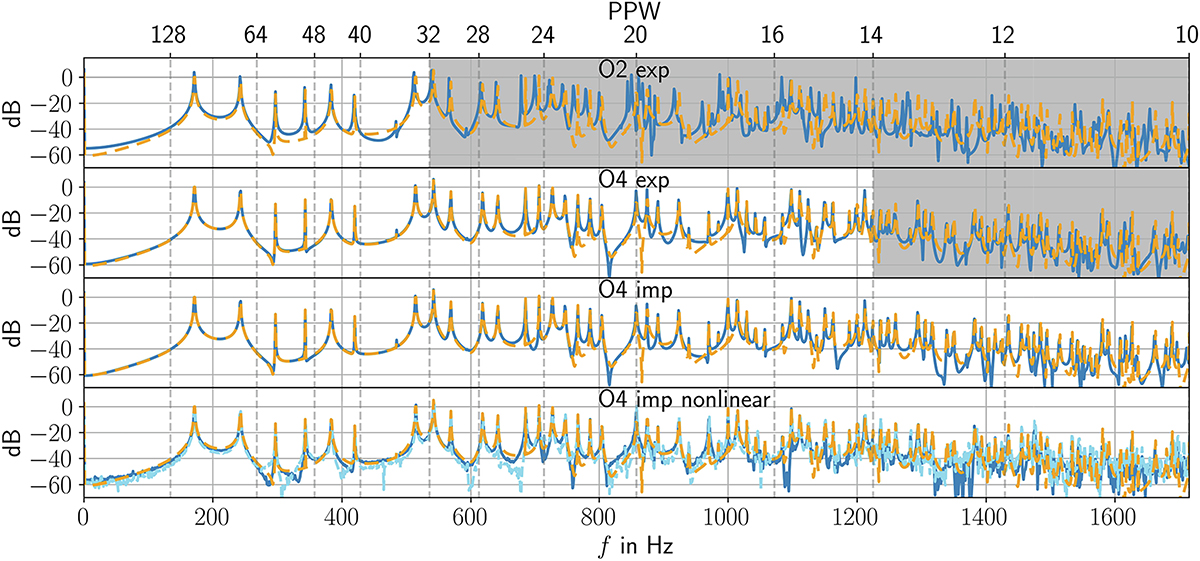
Frequency response of 2nd and 4th order explicit and 4th-order implicit spatial derivatives. The receiver is located at xr = [0.7, 0.8, 0.7]T m and the source is located at xs = [0.2, 0.4, 0.3]T m. The analytical solution is shown in orange dashed and the numerical solution in blue. The gray area marks regions with a theoretical error (k’Δx − kΔx)real > 10−3. The lower non-linear case shows results for high amplitudes, at 0.75 m distance from the source the peak magnitude of the blue line is at ≈146 dBSPL and in light blue dashed at ≈152 dBSPL.
Current usage metrics show cumulative count of Article Views (full-text article views including HTML views, PDF and ePub downloads, according to the available data) and Abstracts Views on Vision4Press platform.
Data correspond to usage on the plateform after 2015. The current usage metrics is available 48-96 hours after online publication and is updated daily on week days.
Initial download of the metrics may take a while.