Open Access
Figure 8
Download original image
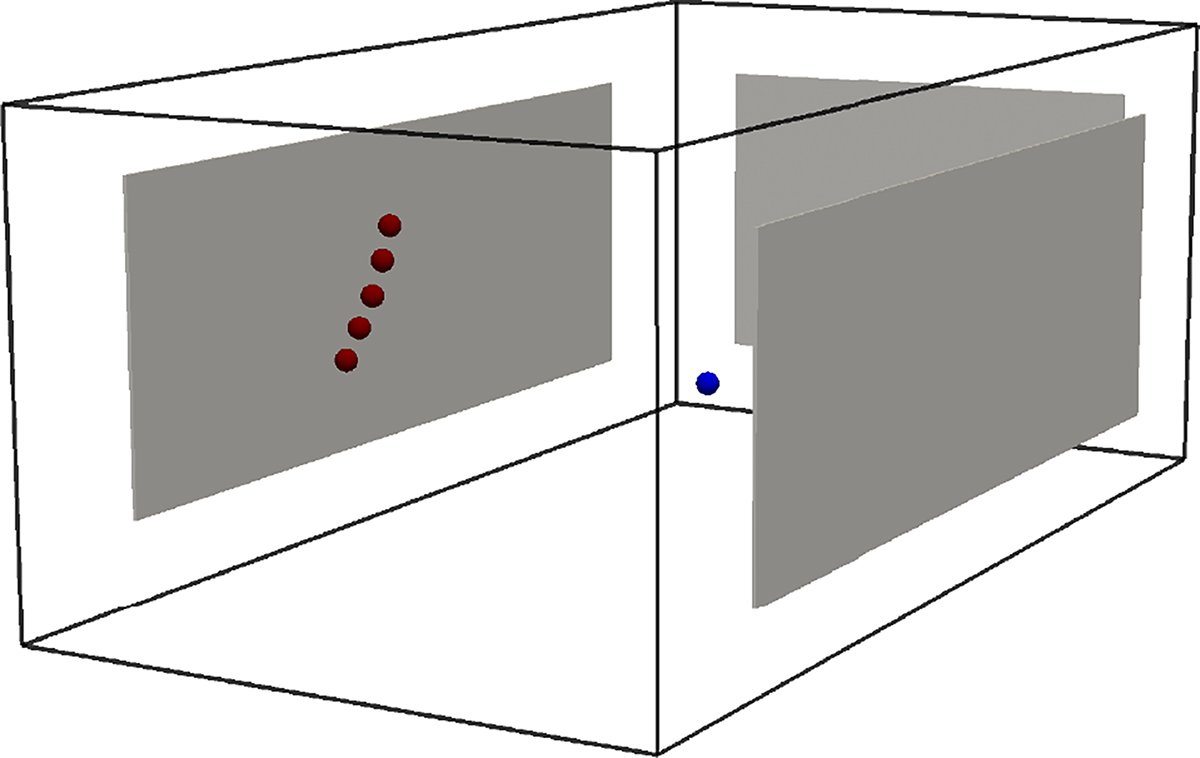
Sketch of the shoebox room. Edges of the room are the black lines, gray areas are porous absorber. Red dots are the source positions, see Table 1 and the blue dot marks the receiver position at x = [8.0; 5.0; 1.5] m.
Current usage metrics show cumulative count of Article Views (full-text article views including HTML views, PDF and ePub downloads, according to the available data) and Abstracts Views on Vision4Press platform.
Data correspond to usage on the plateform after 2015. The current usage metrics is available 48-96 hours after online publication and is updated daily on week days.
Initial download of the metrics may take a while.