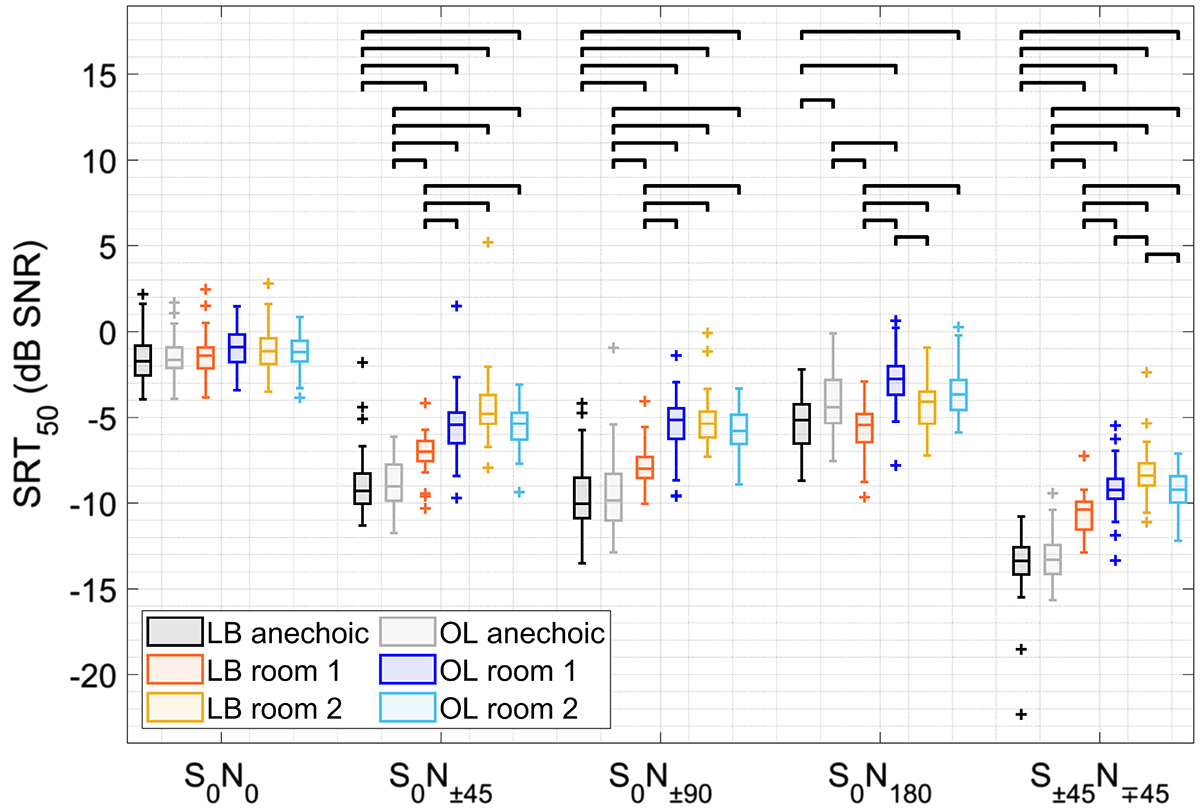
Figure 4
Download original image
Boxplots of all individual SRT (dB SNR) measured in six test rooms per loudspeaker configuration. The boxplots show the medians (middle quartile), the inter-quartile range (IQR) between the first and third quartile (box length), the whiskers (1.5 times the IQR) and outliers (+). Significance bars indicate significant post-hoc differences between test rooms with Bonferroni correction. Corresponding p-values are listed in Table 2.
Current usage metrics show cumulative count of Article Views (full-text article views including HTML views, PDF and ePub downloads, according to the available data) and Abstracts Views on Vision4Press platform.
Data correspond to usage on the plateform after 2015. The current usage metrics is available 48-96 hours after online publication and is updated daily on week days.
Initial download of the metrics may take a while.