Open Access
Figure 19
Download original image
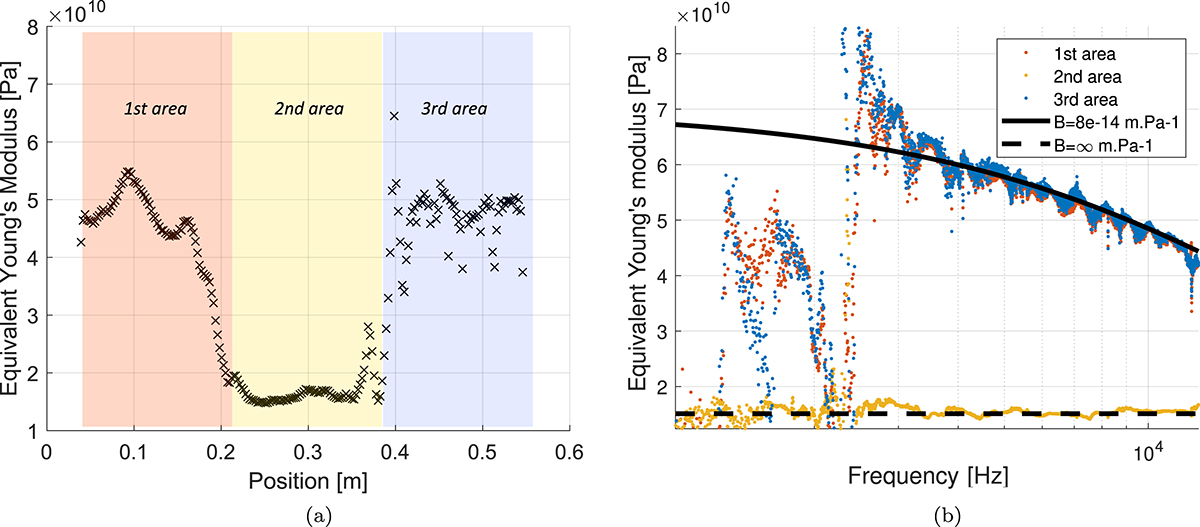
Young’s modulus rigidity with (a) Spatial domain visualization divided in three regions on the frequency bandwidth f = 10000:11500 Hz, (b) Frequency visualization for each region shown in (a). The sample with cellophane has been used to obtain these results.
Current usage metrics show cumulative count of Article Views (full-text article views including HTML views, PDF and ePub downloads, according to the available data) and Abstracts Views on Vision4Press platform.
Data correspond to usage on the plateform after 2015. The current usage metrics is available 48-96 hours after online publication and is updated daily on week days.
Initial download of the metrics may take a while.