Figure 7
Download original image
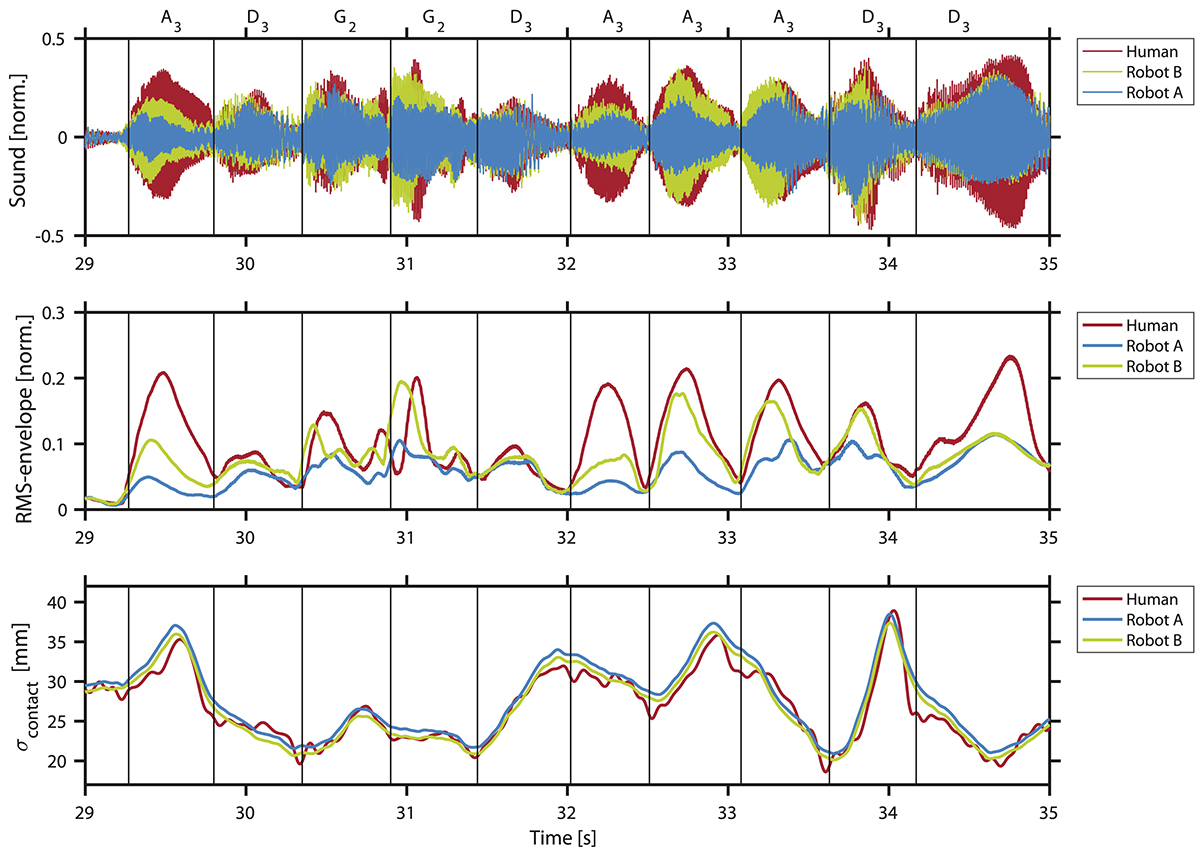
Passage of the recorded data showing the sound envelopes (waveform on the top and RMS-envelope in the middle) and the parameter σcontact, comparing human and robot cases A and B. Vertical lines correspond to the note onsets (played notes A3, D3, G2 indicated at the top).
Current usage metrics show cumulative count of Article Views (full-text article views including HTML views, PDF and ePub downloads, according to the available data) and Abstracts Views on Vision4Press platform.
Data correspond to usage on the plateform after 2015. The current usage metrics is available 48-96 hours after online publication and is updated daily on week days.
Initial download of the metrics may take a while.