Figure 6
Download original image
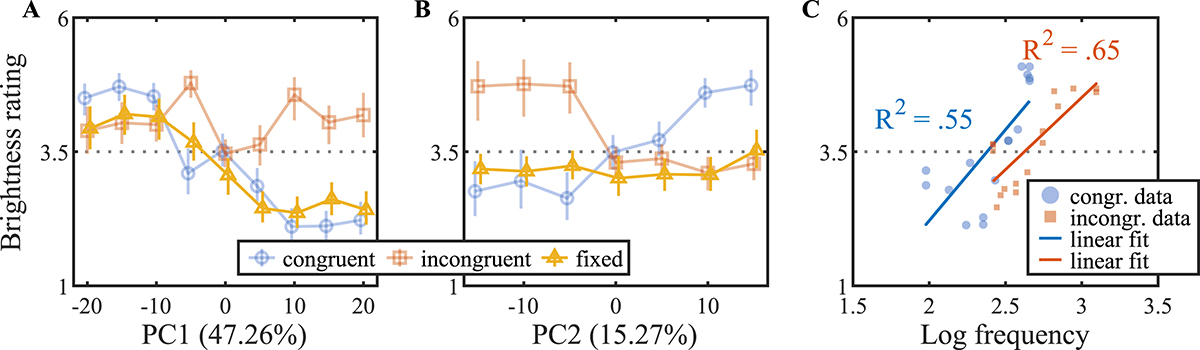
(A) Sound brightness ratings across the first PC for all conditions. Error bars correspond to bootstrapped 95% confidence intervals. (B) Sound brightness ratings across the second PC for all conditions. Error bars correspond to bootstrapped 95% confidence intervals. (C) Linear regression between F0 and sound brightness ratings for the congruent and incongruent conditions.
Current usage metrics show cumulative count of Article Views (full-text article views including HTML views, PDF and ePub downloads, according to the available data) and Abstracts Views on Vision4Press platform.
Data correspond to usage on the plateform after 2015. The current usage metrics is available 48-96 hours after online publication and is updated daily on week days.
Initial download of the metrics may take a while.