Figure 12.
Download original image
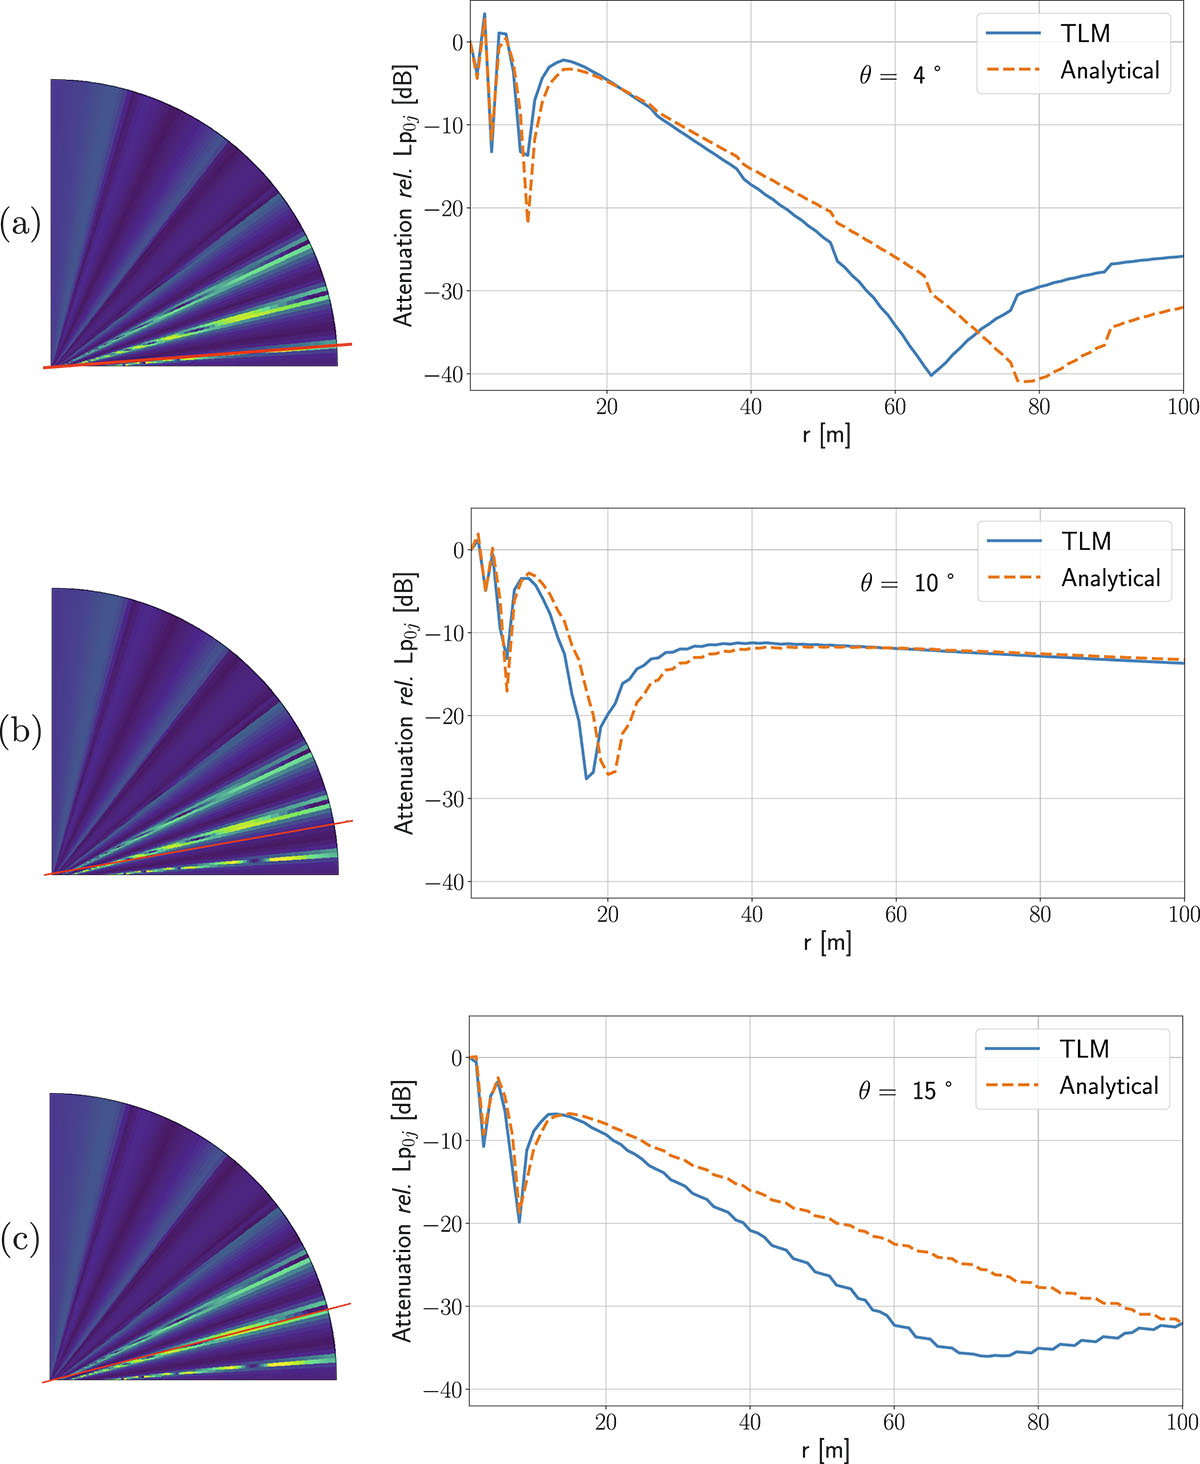
Numerical SPL attenuation relative to a reference receiver according to the propagation distance r (blue line), compared to the analytical solution (orange dashed line) for three source-receiver angles: (a) θ = 4°, (b) θ = 10° and (c) θ = 15°. Source located at hs = 2m and emitting a windowed sinusoidal signal at fmax = 500 Hz (Nppw = 10). On the error maps on the left, red lines indicate the receiver lines corresponding to the SPL attenuation graphs on the right.
Current usage metrics show cumulative count of Article Views (full-text article views including HTML views, PDF and ePub downloads, according to the available data) and Abstracts Views on Vision4Press platform.
Data correspond to usage on the plateform after 2015. The current usage metrics is available 48-96 hours after online publication and is updated daily on week days.
Initial download of the metrics may take a while.