Open Access
Figure 2.
Download original image
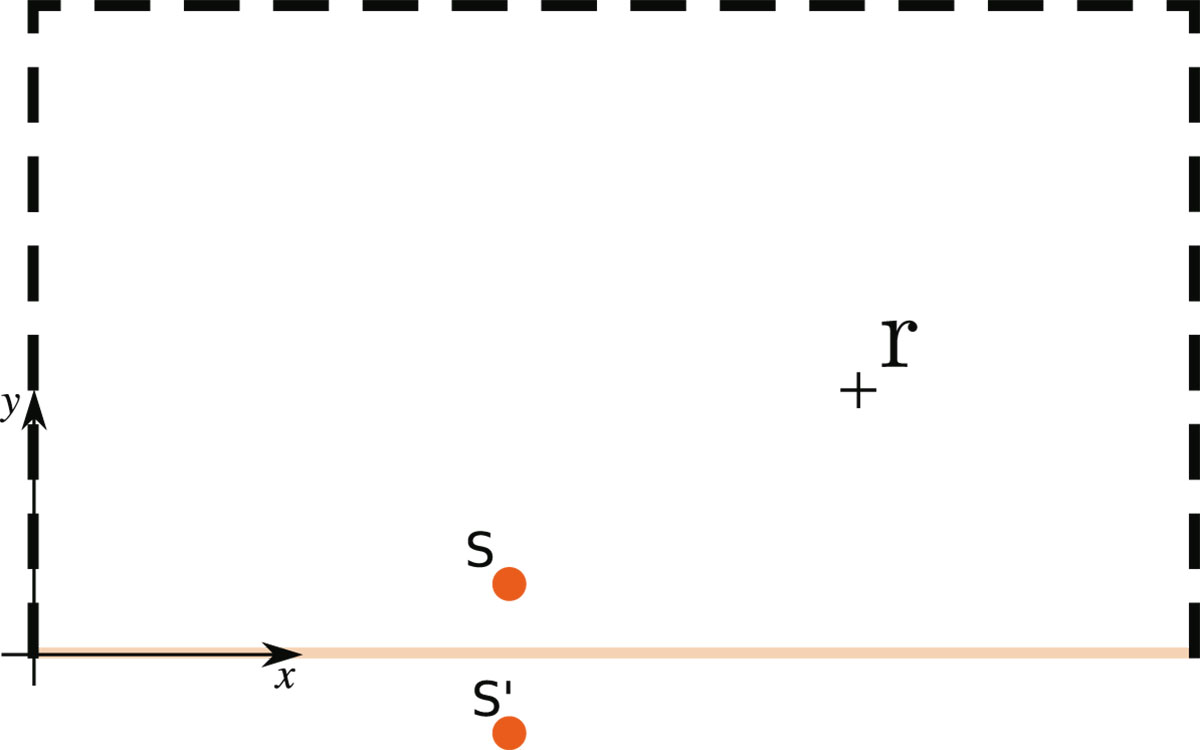
Numerical experiment setup with the image source theory. The dotted lines represent free boundaries and the orange line a perfectly reflective boundary.
Current usage metrics show cumulative count of Article Views (full-text article views including HTML views, PDF and ePub downloads, according to the available data) and Abstracts Views on Vision4Press platform.
Data correspond to usage on the plateform after 2015. The current usage metrics is available 48-96 hours after online publication and is updated daily on week days.
Initial download of the metrics may take a while.