Open Access
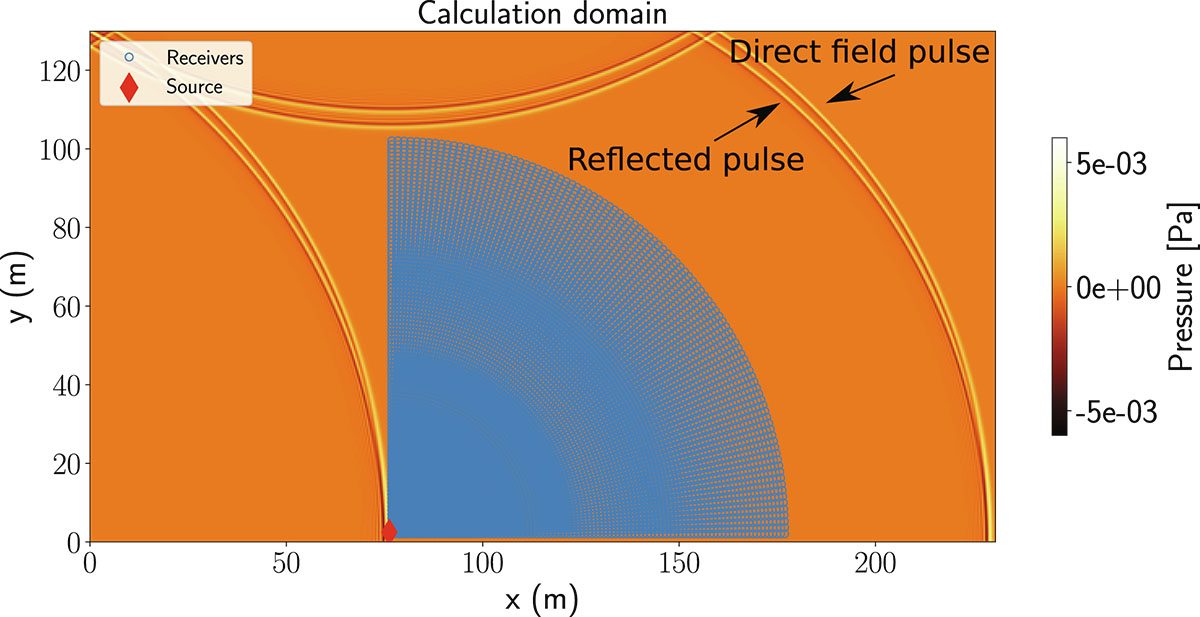
Figure 5.
Download original image
Sound pressure field for a Gaussian source at the end of the TLM simulation. The whole calculation domain is represented. At the last iteration of the calculation, reflected and incident waves have passed through all the receivers (blue dots) in the network.
Current usage metrics show cumulative count of Article Views (full-text article views including HTML views, PDF and ePub downloads, according to the available data) and Abstracts Views on Vision4Press platform.
Data correspond to usage on the plateform after 2015. The current usage metrics is available 48-96 hours after online publication and is updated daily on week days.
Initial download of the metrics may take a while.