Figure 8
Download original image
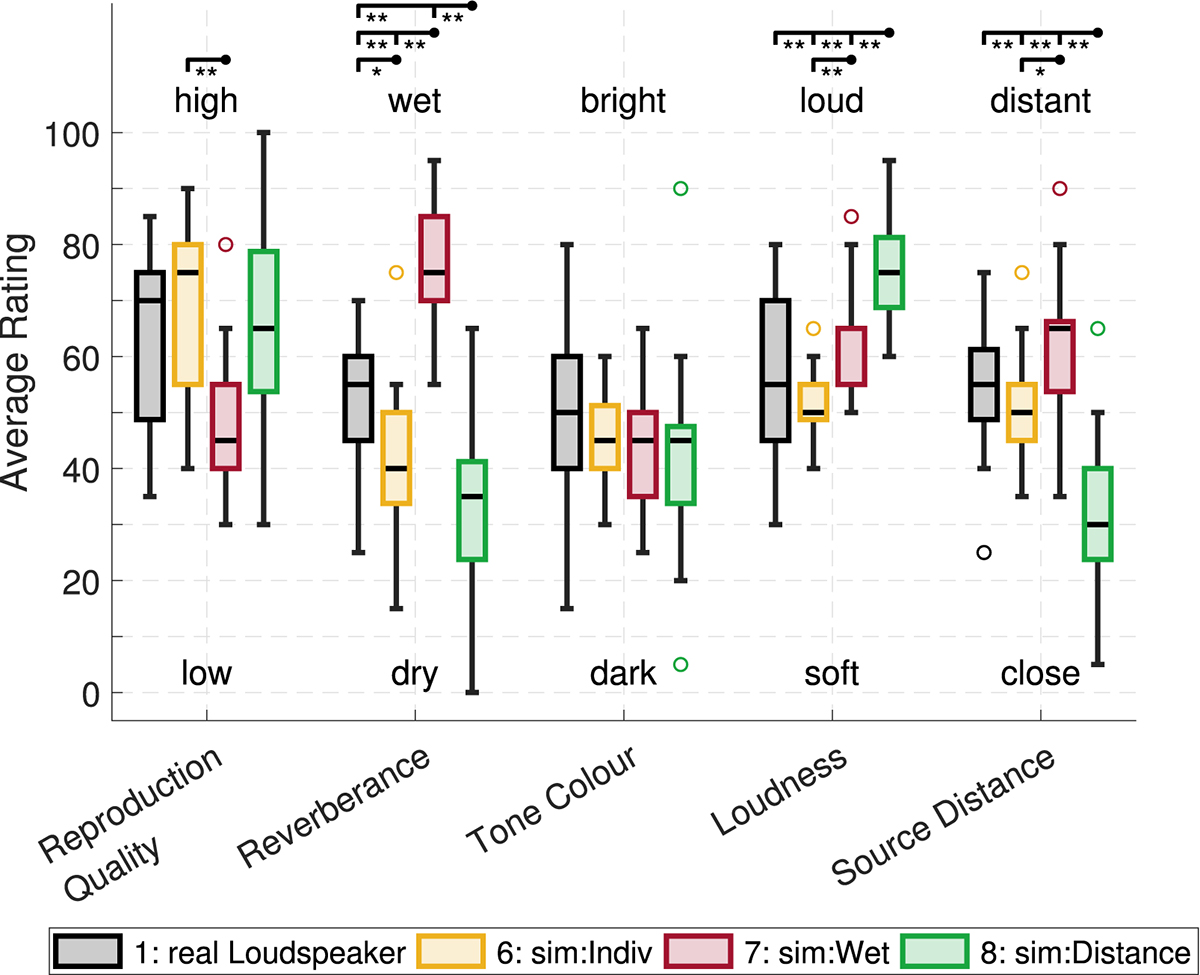
Box plots showing ratings averaged over the repeated measurements as a function of room acoustic attributes. Introduced manipulations, such as increasing reverberation or decreasing distance, are compared to the real measurement and the simulation without manipulation. Significant differences are shown from the dot to each downward tick on the respective line. This data is a subset of Figure 5, and the Bonferroni-Holm correction has been applied to the whole data set.
Current usage metrics show cumulative count of Article Views (full-text article views including HTML views, PDF and ePub downloads, according to the available data) and Abstracts Views on Vision4Press platform.
Data correspond to usage on the plateform after 2015. The current usage metrics is available 48-96 hours after online publication and is updated daily on week days.
Initial download of the metrics may take a while.