Figure 3
Download original image
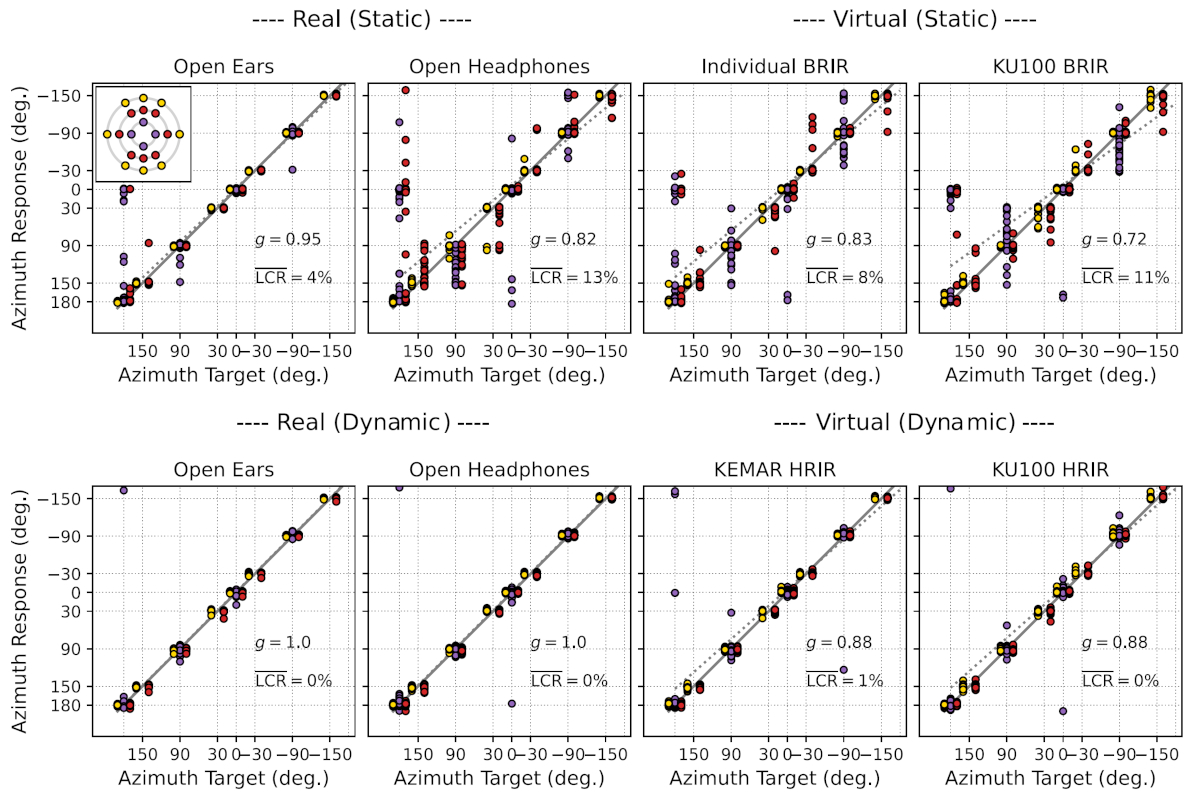
Azimuth component of localization responses in the static vs. dynamic listening experiment for loudspeakers at 0, 30, and 60 degrees elevation (N = 16). Responses to the different target elevations are displayed in different colors (gold: 0 degree, red: 30 degree, purple: 60 degree) and are horizontally spaced around a corresponding target azimuth. The average local confusion rate (![]() ) is reported alongside with the slope g of the regression line.
) is reported alongside with the slope g of the regression line.
Current usage metrics show cumulative count of Article Views (full-text article views including HTML views, PDF and ePub downloads, according to the available data) and Abstracts Views on Vision4Press platform.
Data correspond to usage on the plateform after 2015. The current usage metrics is available 48-96 hours after online publication and is updated daily on week days.
Initial download of the metrics may take a while.